You should use candlestick charts because they’re much more readable than any other type of charts. You can do an analysis quickly and make better decisions that lead to better and more profitable stock trades. Reading of these charts is the bread and butter of many technical stock trading strategies.
Candlestick charts examples
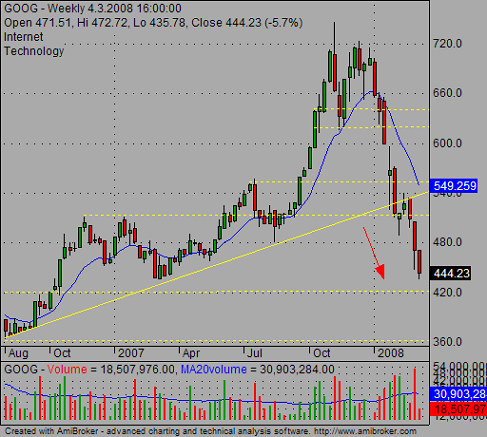
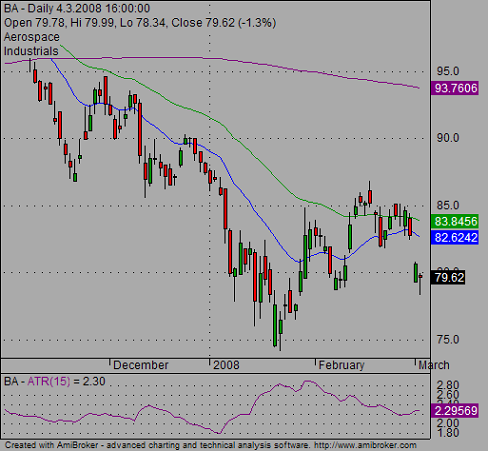
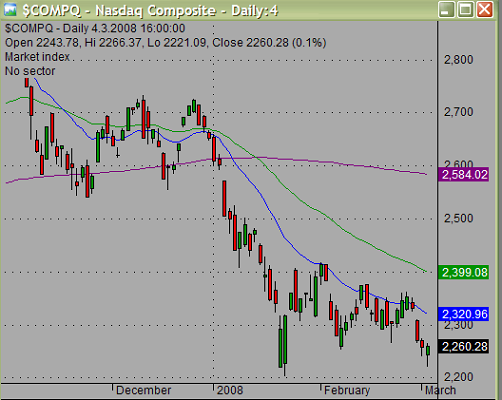
Check these examples of price charts:
When not to use this chart’s type in your market research software
But sometimes it’s better NOT to use such charts. I find two occasions when a line chart is better.
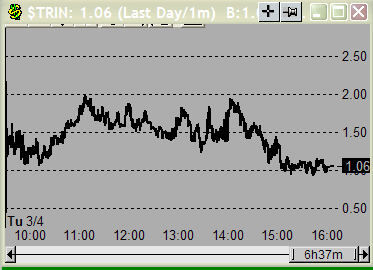
The first is an intra-day chart of some sentiment indicator like TRIN:
The second occasion happens when I need to compare a relative performance of two or more shares or index symbols.
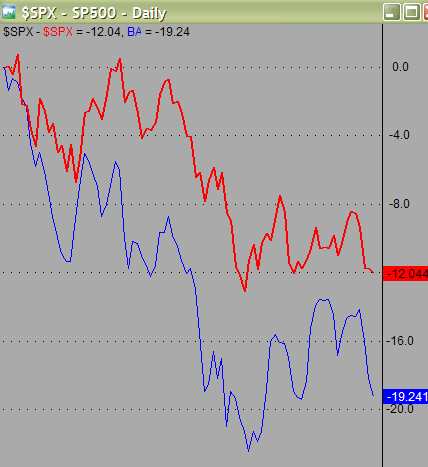
Multi time frame charts
Candlesticks should be used also when you set up multiple charts in different timeframes. This stock chart setup is important for good technical reading of current market situation. Such a setup is good for daytraders and short-term traders but also for active investors. These historical charts provide much better picture for a price behavior research.
And the knowledge what is an actual market trend is necessary to produce much better trade results for your market system.
Technical candlestick chart patterns
Use these graphs also for visualization of price chart patterns. These patterns are one of the best technical tool for traders. Candlestick charts provide also very valuable information about bearish candlestick patterns or bullish candle patterns. These patterns represents another valuable info for better trading decisions.
Importance of candlestick charts
Every single candlestick on price graph provides a lot of info for an analysis of the share price. Using candlestick analysis basics together with important candlestick patterns and other basics of technical analysis leads to the creation of a profitable strategy to make money on US exchanges.
These Japanese style charts of stocks, ETFs, indexes, currencies, commodities are better for visual analysis and trade decisions. Learn to use them for your trading needs.
Find more on related pages
- Bearish candlesticks know how
- How sell short using bearish candlesticks patterns
- Keep learning more from this candlestick tutorial