If you are a technical trader or is you use charts in your stock trading strategies, you tend to look for the ideal technical tools for your needs. Many starting traders often discuss what the best moving average is, what is the top technical indicator they can use on their charts.
The secret is that there is no single universal best technical indicator for every strategy, every trader and every time. Each technical indicator has its strength and weakness. Here below you can read about different moving averages and what is their best usage.
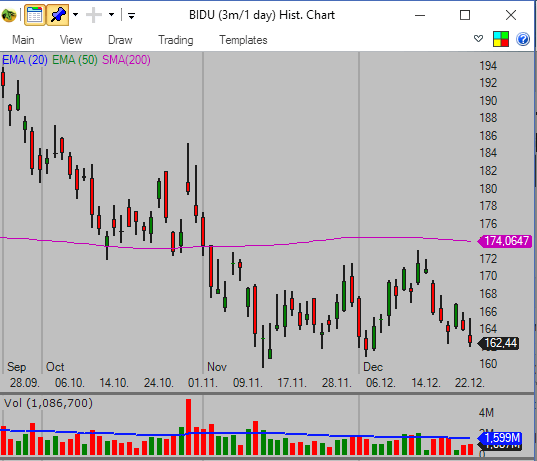
The 200-day moving average
This is long term moving average. Its importance lies in general description of a situation. This technical value is use especially by big money managers in their investing decisions. These money managers move a huge amount of money and so their actions can affect the price of individual stock a lot.
Many of these big money managers tend to sell stocks that decline below the 200-day moving average. You can notify that selling intensifies after the price break below this long-term moving average.
The rule for stock traders is: What is below the 200-day moving average tends to be a better bearish opportunity. Bullish opportunities have a price above the 200-day moving average.
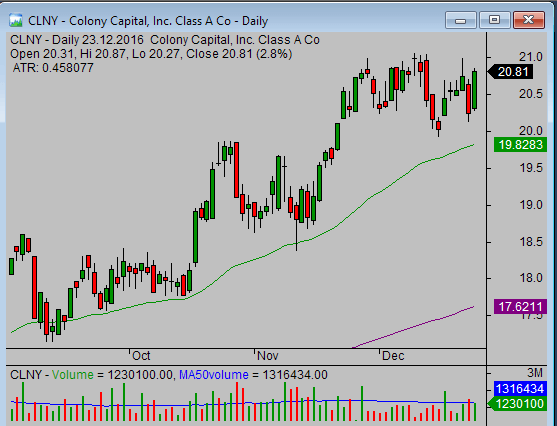
The 50-day moving average
The 50-day moving average is a useful tool for swing traders and position traders. This is very popular technical indicator also among big funds that manage huge amount of money.
The primary purpose of this indicator is that it serves as a support level. You can use with a great deal of success in any of your technically based pullback strategies. If the price pullback stops near this level and the price starts to create reversal candlesticks, you can think about possible new trade. The above average volume levels are additional hint in such situation.
Stock traders hold positions based on the 50-day moving averages for several weeks, sometimes months.
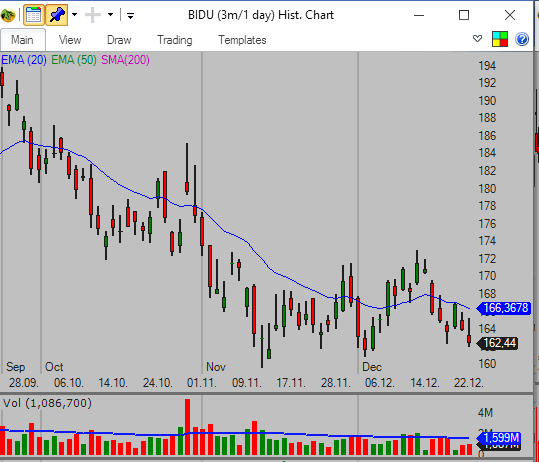
The 20-day moving average
The 20-day moving average serves similar function as the 50-day MA described above. The difference is in importance of such price level. The 20-day moving average price level is often considered as weaker than the 50-day average price.
Trades based on this moving average also shorter. They typically last only a few days, sometimes a week or two. This is popular indicator used by short-term swing traders. They use them in a similar way like the 50-day MA, as moving support and watch for signals for new trade entries.
The 9-day or 10-day moving average
Some stock traders also use this short-term moving average. These traders are very short term traders, often daytraders.
The reason to use this moving average in swing or position trading can sometimes be to find if the price moves in some price range during the last week. If the price is close the 10-day moving average then you can decide that the price forms a range – maybe in some pullback. If the volume starts to increase, then it can indicate possible start of new trend move. Either up or down.
Select the best moving average that fit your style
Moving average is simple but powerful technical tool for stock traders. The 200-day moving average is useful for every trader or investor. And other averages you can use if they fit your trading strategy.
Find more on related pages
- Basics of moving averages
- Pullback retracement levels for trading
- How to read stock chart with more technical indicators
- Understand key ideas of profitable stock chart analysis