Knowledge what is bullish and bearish stock is key for successful stock trading. Selecting the most bullish stocks or most bearish stocks is one of the key steps in trading strategies based on relative strength approach.
Stock traders use very bullish stocks to trade them using some bullish strategies. Breakouts and pullbacks are some of them. They are popular but also extremely useful.
Why know how to find bullish and bearish stocks
You have to use bullish and bearish strategies for several reasons.
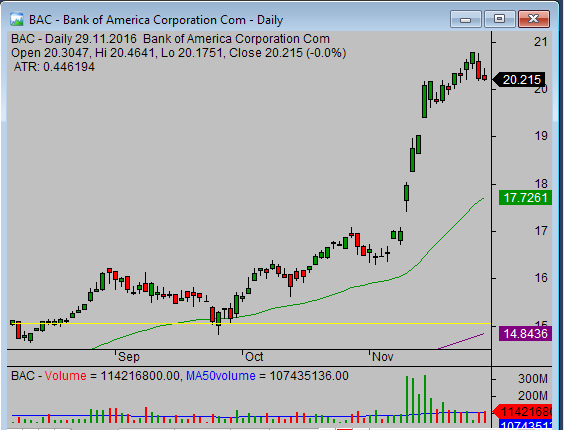
Top bullish stocks often move in very strong uptrend moves. The price rises in waves. The length and strength of such price increase are often much larger than the price increase of other stock. The most bullish stocks also experience only minuscule pullbacks.
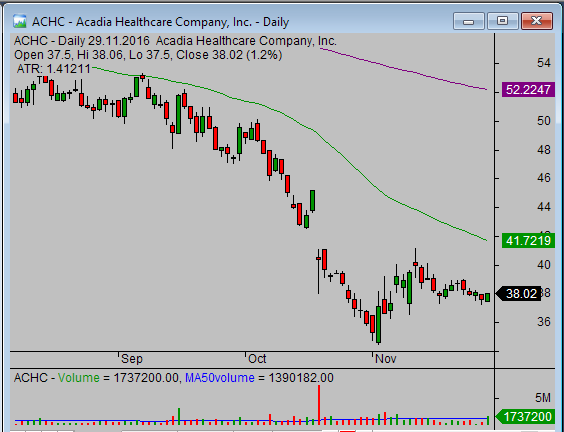
Bearish stocks are ideal candidates for bearish stocks strategies. They show significant weakness and their price decreases. You can find bearish stock almost anytime, even in the strong bull market. The price decline for very bearish stocks is often quick. Their price drops are deep. Bearish stocks represent an opportunity to make money using appropriate trading strategy very quickly comparing to bullish trading strategies.
What is a bullish stock
The main characteristic of bullish stock is uptrend behavior. The stock price rises as many investors and also short term traders buys the ticker in expectation of further price gains.
The second, but also a crucial attribute of very bullish stocks, is that their price experiences only small pullback when the general market indexes rest.
And finally, the strength of top bullish stocks means that their price also rises during market decline.
What is a bearish stock
A typical attribute of bearish stock is that its price fails to rise. You can note such price action especially during a time when general market index rises. This attribute is also known as relative weakness.
The pullback that takes the price little bit up again during much longer price declines is often quite small.
Tools to create list of bullish stocks
The simplest way to create list of bullish stock is to analyze stock charts. Technical tools that you can draw on a chart are excellent aids for identification of top bullish stocks or very bearish stocks.
Moving average is a technical tool that allows you to see situation on a chart quickly. Using the 50-day moving average as a definition tool is relatively easy way to spot strong stocks or weak stocks.
The key rule is that the price of bullish stock should be above the 50-day moving average. The opposite is true for bearish stocks. You can see examples on the charts above.
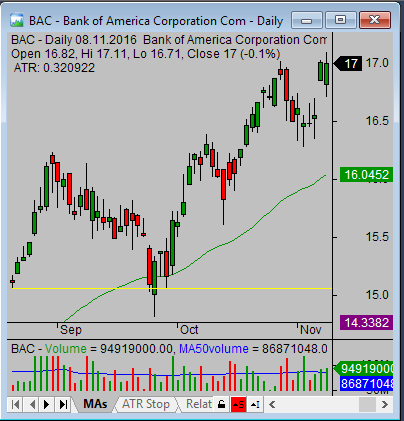
The second way to identify bullish or bearish stocks is to compare the price action of stock with the main stock market index, like the S&P500 index for U.S. equity markets. If you see that the price of stock rises much stronger that the index value you know that such stock is an excellent bullish opportunity. Check the two charts below.
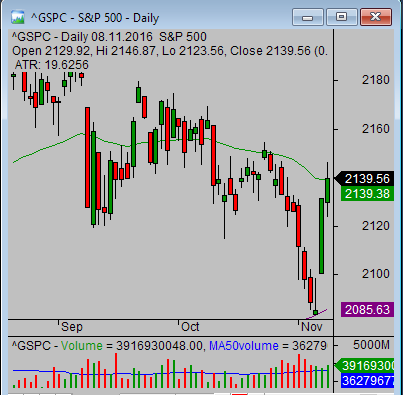
And if you see that the price of a stock dives down especially during the market uptrend, then such ticker can represent good bearish trading opportunity for the next days.
Learn to identify bullish and bearish stocks
The strength or weakness of individual stocks helps to move the price. These stock experience strong buying and strong selling. This action performed by other investors and traders helps to move the price in the direction you want to see. You want to use these moves for your trades as they are much easier to trade. So you have to understand how to recognize top bullish stocks and the most bearish stocks. They are ideal trading opportunities for the next days.
Find more on related pages
- Bullish candlesticks patterns for stock traders
- Reasons to look for bearish daily stock picks
- How to use relative strength for technical stock market analysis
- Find more tips for good stock chart analysis