An engulfing candle pattern is an example that shows the significance of a single candlestick in stock trading. Engulfing patterns are very usable tools for technical analysis that help you, a stock trader, to make the right decisions at the right time.
What is an engulfing pattern?
This simple candlestick pattern is based on two candlesticks. The first one is typically small, and the second one is larger than the first one. Also, the second one completely engulfs the previous one. To technical traders, this action means the situation is changing.
You can find this situation either after a bullish trend up; in this case, it’s a completely bearish engulfing candlestick. The second option is the opposite. The bullish engulfing candlestick happens often after a severe down move.
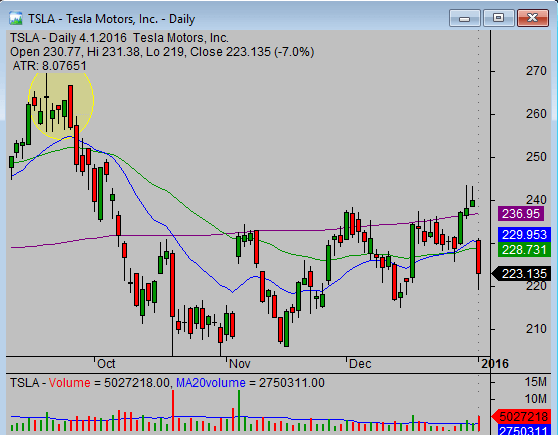
Bearish engulfing candlestick example—TSLA chart
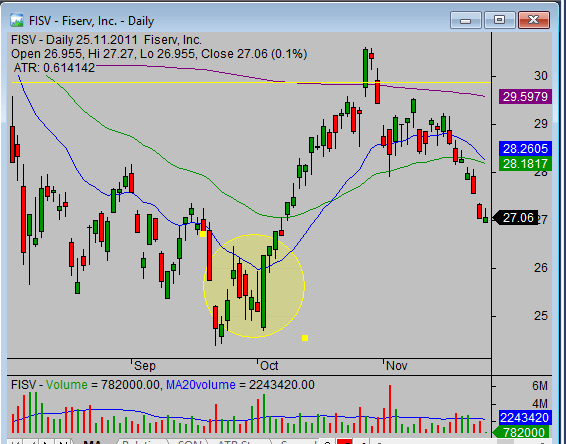
Bullish engulfing candlestick example—FISV chart
How to use an engulfing candle in swing trade strategies
The first way to use it is when you’re in some trade and an engulfing candlestick appears. What does it means and what to do now?
When you see the bearish engulfing pattern and you actually hold a bullish trade, there are several options.
- You can exit the trade immediately since this bearish single candlestick is very negative and signals more downside ahead. This is a solution if you prefer to make shorter trades, like swing trades based on daily or 240-minute charts.
- You can close part of your position, typically a half position or more. And you will keep the rest. You should expect more decline and some form of a pullback.
- Do nothing since your trade time frame is much longer, and you expect only a pullback in the current longer trend you want to ride.
Your trading plan should describe what you will do in such a situation.
The bearish engulfing candlestick can lead to a trading opportunity
If you’re not in the trade, then this bearish candlestick pattern can notify you that a bearish trading opportunity can soon develop in this particular stock. That stock reaches its high, and most traders and investors start to sell their positions.
And since the selling is always more emotional, you can expect the price decline to be quick and strong. Sometimes, it’s stronger than bullish traders holding a position in the stock expect. This leads to an unpleasant surprise that forces them to sell. Such selling adds fuel to more declines. So the trend reversal can happen, and it’s often a very good short-selling opportunity for swing traders.
Meaning of the bullish engulfing candle
Quite the opposite to the previous paragraph is the bullish engulfing pattern. You find this pattern after some decline. Base your reactions on whether you have a short-sell position or not. If you have a short-sell position, then you should apply your trade management rules. Several choices are possible.
- You can exit the trade immediately since this engulfing pattern is a warning signal that the trend is reversing. The shorter the time frame for your trades you most probably have to exit the trade. Also, if the volume increased during this reversal day, it makes this signal much more important.
- You can exit your position partially, covering half of your shares as a minimum. You can expect the decline to continue later, and this candlestick is only a signal for a small pullback.
- You do nothing. It’s a possibility if your preferred trade length is much longer than a few days, typically if you prefer position trades. You can expect that this is a start of a small pullback in a longer trend move down and that the price will reach much lower levels.
If you’re not in the trade, then this pattern can signal that the trend in this stock can reverse, and a bullish trading opportunity can emerge soon.
Rules for engulfing candlestick trading stock strategies
There are several reasons to monitor price development closely and do something when you see engulfing candle on your chart. You should define what you will do in your stock trading strategy. You can use the points above to make your trading rules more specific for these situations.
Find more on related pages
- Learn more about bullish candlestick patterns
- Short-sell trading ideas
- Explore other tips for stock trading strategies