Fibonacci retracements are some of the best stock market trading tools. Although Fibonacci values look very simple and easy they’re a very powerful tool for profitable traders.
The retracement – or pullback – areas defined by this technical market indicator are used by traders on many markets to trade shares, commodities or Forex – currencies.
The retracement size helps to analyze the strength of the market trend. Fibonacci tool helps to set up possible stop loss levels or target levels for trades.
Use retracements to find strength
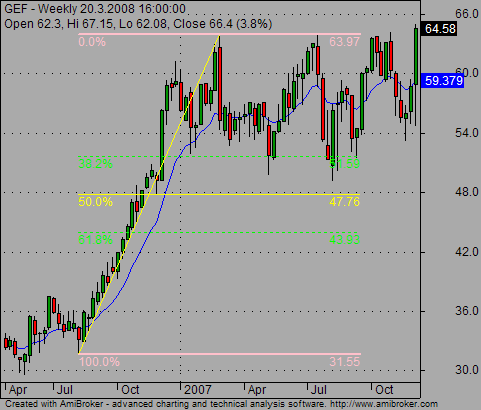
This first chart shows a situation in GEF market ticker. After a strong uptrend move in the second half of 2007, the share price consolidates in the upper part of the whole rising move.
Using the Fibonacci indicator available in AmiBroker chart analysis software, you can see that shares couldn’t move lower than first retracement area or about 38-40% of last uptrend move.
It signals the strong interest of buyers and no interest in selling GEF shares. It looks that investors aren’t willing to sell these shares. Instead, every pullback to the first important retracement level is used as a buying opportunity. Resolution: This is a strong stock and is worth buying.

Use fibonacci levels to find a target for trade
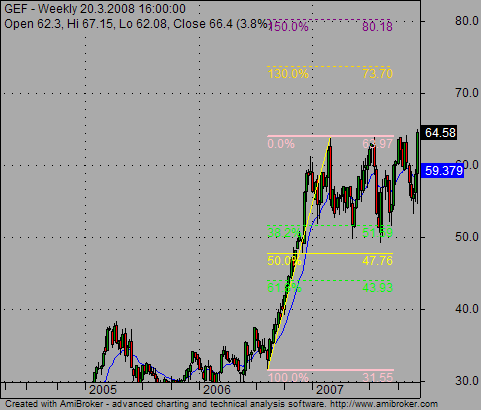
The second chart shows possible usage of the Fibonacci retracement and extensions stock market trading tool for specifying a target for stock trade.
Since the chart doesn’t offer another hint for a target of the trade (like some old resistance levels), you can use extensions of the retracement chart analysis tool. 130% or 150% level could be seen as possible targets for a long trade.

Tip for Fibonacci pullback levels
Combine Fibonacci retracement areas with another type of support and resistance. The more types in one price area, the stronger type of level it is.
The ideal additional hints can be provided by moving averages and horizontal price areas of support and resistance. It is also good to check candlesticks that are painted on the price chart in these levels.