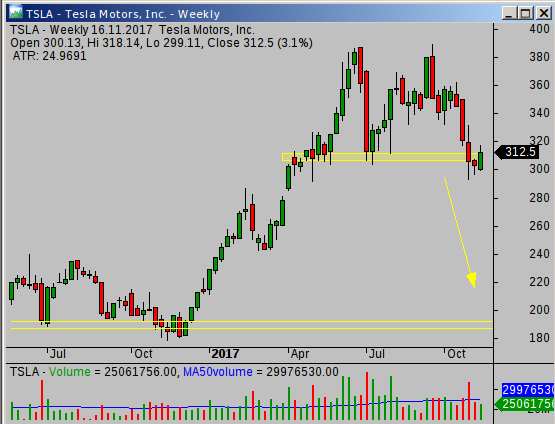
TSLA was in a strong uptrend in the first half of this year. Technical situation deteriorated since September. As far as I know, its financial situation (sales, earnings, etc) is still not good and company is not profitable.
The weekly chart shows a massive double top chart pattern. I expect more decline coming in the next weeks and months. I plan to prepare a trade based on this decline with details published in my members-only site.
Trading Tip:Double top reversal stock chart patterns tips
Double and triple top stock chart pattern is a common chart pattern. Learn more how to make money using this technical chart situation.
Picks from Richard’s Trading Club
Bullish stocks and etfs : IGN, WGO and more
Bearish stocks and etfs: TUR, CLH and more
I use the best four stock screeners to find stock picks every week.