Triangles are important stock chart patterns. They offer very good probability for continuation of a trend when the price breaks from this pattern.
This type of continuation chart pattern can be found on any time frame and so is usable in any type of stock trading. Day traders can find it on intraday live stock charts of stock market index or any other ticker they want to day trade.
This chart pattern is also often visible on daily and weekly charts used by swing traders or position traders. This chart pattern plays also important role for active investors as they can see it on weekly charts for their mid term positions in their stock market portfolio.
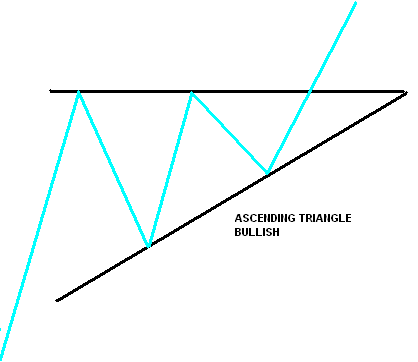
Ascending triangle chart pattern
This version of a chart pattern is considered bullish. It has very good reliability if it is found in an uptrend. As you can see in the illustration, there is horizontal resistance at highs and a rising support line at lows.

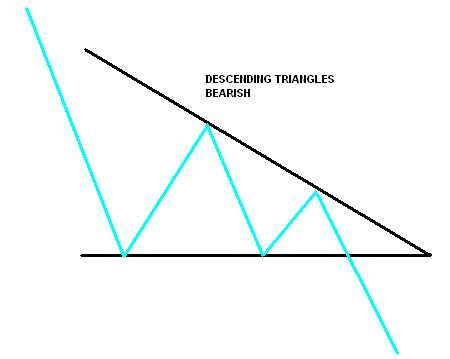
Descending triangle chart pattern
This version of a pattern is considered bearish. It has very good reliability if it is found in a downtrend. The resistance is a declining downtrend line, and support is at the horizontal level.

Ascending or descending chart pattern is often found during consolidation (pause) time after some strong trend move. I like them as they are ideal version of trading chart patterns for breakout or breakdown stock market strategies that I often use in my stock and ETF trading.
You should include trading of bullish or bearish versions of this pattern into your strategy. It could generate huge profits as break of the price from this pattern is often followed by strong uptrend or downtrend move.
Find more on related pages
- Gather more about trading triangle chart patterns
- Understand importance of individual stock sector analysis
- Read more ideas about using stock chart patterns