Stocks technical analysis is a way how to analyze actual situation and predict future movement of the ticker, sector or index. This is huge area and it is possible to use many different tools to do this task.
The most effective way is to use only few tools for stocks technical analysis. The best way is to learn technical analysis tools and indicators that are most effective. Here is a list of four major tools that you should use.
Support and resistance
Support and resistance are two core terms used in technical analysis of stocks. You should understand this concept and how to easily find these levels on a technical price chart. The knowledge how to properly identify levels of support and resistance is key factor for profitable position and swing stock trading.
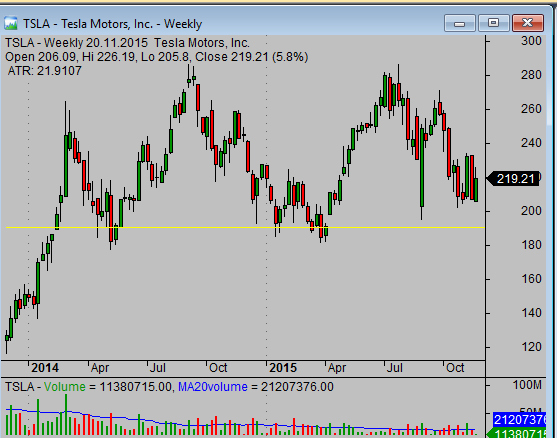
Price support on stock price chart
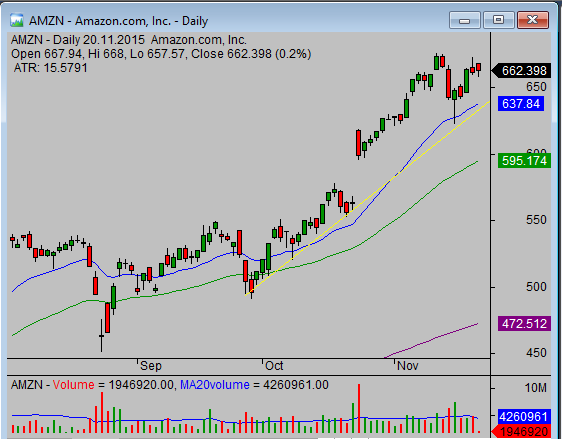
Moving averages
Moving average is a technical analysis tool that is quite common and often mentioned. Many traders and investors tend to underestimate the importance of moving averages. This simple tool is very powerful. Many profitable stock trading strategies use some form of moving averages.
Moving average indicator could be defined with different parameters. Many traders like to set up very specific values for this technical analysis indicator. You can experiment with it but basic settings for major moving averages work very well.
Trendlines
Trendline is a tool used for technical analysis of stock price movements. The best way to use this indicator is to draw it by hand but you can find some technical analysis software that is able to draw major trendlines automatically.
You should understand the concept of trendlines. This simple tool has very big importance for trading strategies. Using of trendlines often defines whether the trading strategy is profitable or not.
Trendline created on stock price chart
Retracement levels
Retracement levels are simple technique for understanding of an actual situation. You can apply this technique of technical analysis to single stocks, market sectors or major market indexes. You should be able to predict the strength of actual trend situation.
The Fibonacci retracement levels are often overlooked by traders and investors that are looking for more sophisticated technical analysis indicators. The main strength of the retracement level tool is exactly in its relative simplicity.
Find more on related pages
- Understand basics of moving averages
- The best stock chart time frame setup
- Learn more about chart analysis