The default stock chart time frame for your chart analysis is based on your type of trading. Daytraders use some intra-day time frame selection based on minutes. Position traders and swing traders use weekly and daily charts i.e. long term charts type.
But whatever style of trading you have, daytrading, swing or position trading, you must analyze more than one type of chart.
Any time you analyze a price chart, you need to see important levels of support or resistance. If you look into one price chart time frame only (say, a daily time frame) and omit others, you are making a big mistake!
There is a solution. Use three different chart time frames for your technical chart analysis.
- Your main time frame (like daily)
- One time frame with a longer scale (like weekly)
- One time frame with a shorter scale (like hourly or four hours)
It is important to check more time frames on your charts
There are two reasons for checking more than one time frame on stock charts:
- You will see important support and resistance levels on a larger scale than your basic one.
- A smaller time frame will help you fine-tune your entry point and stop loss level for your trade.
So what is typical time frame used by successful traders?
- Daytraders
Basic charts …. 15min , 30 min, hourly
Longer one … 240 min (4hours), daily
Shorter one … 5min , 15 min
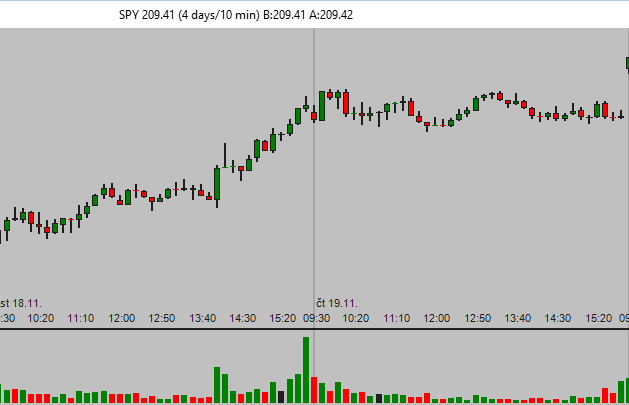
10 minute intraday chart SPY
- Swing traders
Basic charts …. daily
Longer one … weekly
Shorter one … hourly or 240 minute (4 hours)
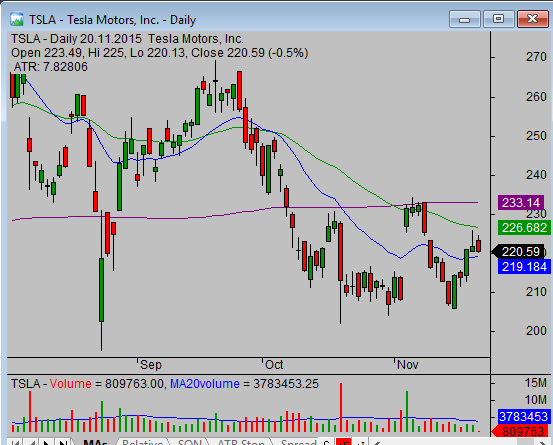
daily chart TSLA
- Position traders:
Basic charts …. weekly
Longer one … monthly
Shorter one … daily or 240 minute (4 hours)
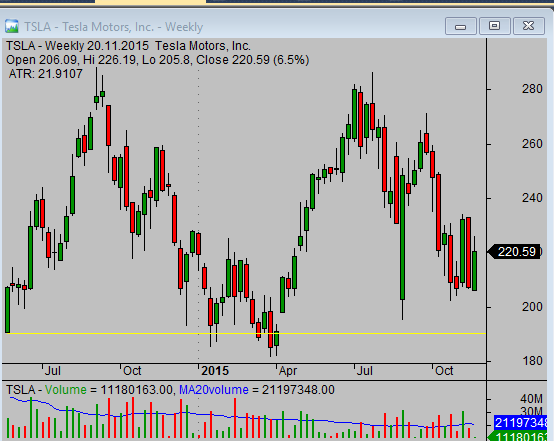
weekly chart TSLA
I have multiple time frame setup on my trading notebook where I see several different time frames for single market ticker.
The trading PC in my home office is connected to three monitors that offer huge visible space. I use it to set up large charts for several different time frames. The definition of best chart layout in my stock analysis software is not constant and you will change it several times during you trading career. Test what works for you and stick with it.
I publish many different time frames charts in my regular free newsletter for traders. Subscribe to this
free stock trading newsletter and learn techniques for best usage of multi-time frame charting.
Find more on related pages