Using candlestick stock chart for analysis and trading decision is core element for many stock traders and investors. But do you know ideal set up for such a chart? You can set it in many different ways.
Your trading results will improve if the layout of candlestick stock chart will be the best for your trading style. When you will be able to read and understand situation that is presented on the computer screen, then you will be able to make correct decision. You will have your stock trading strategy profitable.
Time period for your candlestick stock chart
You have to consider resolution of your monitor when you set the layout of your chart. The smaller monitor the harder will be to read long period of time. Compare these two charts.
The first one has a one year period presented. As you can see the individual candlesticks are too small. You are not able to analyze them properly. This chart is hard to use for analysis.
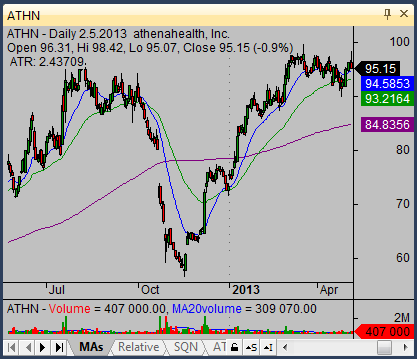
The second one shows only 3 month period. This daily chart is much more readable. You are able to perform good analysis. You see every individual candlestick, you can recognize candlestick patterns that are in front of you.

Use another time frames, when you want to see a larger period of time. The weekly or monthly chart is ideal option for daytrader or swing traders. Daytraders will use daily or 4-hours time frame for their longer date range overview.
Look at this weekly chart where you can see more than one year of price action.

Indicators and candlestick chart
Another common problem for many less experienced traders is that their charts are filled by many different indicators. They use bollinger bands together with moving averages, the MACD and Stochastics. When they start to draw trend lines or retracement levels, the situation becomes unreadable.
These traders have problem to read and analyze situation they see on the screen. Too many indicators also give them too many different signals. They are not able to make decision that leads to profitable trade.
I recommend to stick to basic indicators. Long term candlestick chart should be without any indicator, you can add volume only.
Find more on related pages
- See how to time your stock buys using candlestick charts
- Learn shooting star candlestick trading tips and ideas
- Read more about candlestick chart analysis