Stock chart reading is primary activity of any technically based trader. It means that if you plan to make swing trades, position trades or even daytrading, you have to understand how to read stock charts.
Technical analysis is a discipline that you have to understand and be master in it. The basic of chart reading, indicators, ways to chart the stock price are only few issues you have to learn and use.
I have created this special section of my web dedicated to stock chart reading lessons and tips that I learned during my trading career. Many of them are not about technical analysis but about the approach to chart reading.
Chart layouts
The first part of this tutorial describes the ways how to set the layout for chart reading. It is very useful to have several charts with different time frames on the screen together to have ability to check situation.
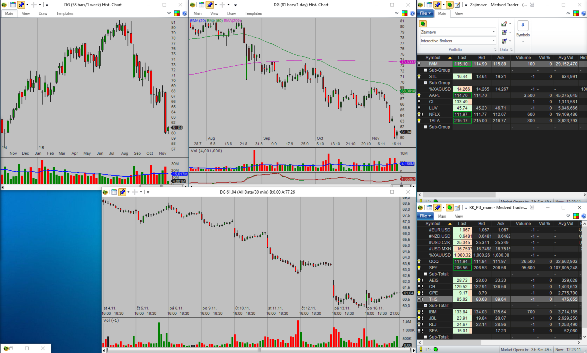
Sample chart layout
Another text describes the way how to have readable stock charts that make your technical analysis easy.
I do not recomend to use many different indiciators on your chart. But if you have some special indicators and want to use them, here are tips that help you to incorporate them into your chart analysis without inhibiting the readability of your charts.
Do not forget to use multiple time frame analysis in your chart reading. It improves results of your analysis.
Free online stock charts
Plenty of traders want to use free resources to save money. It can be good and usable if you learn how to trade, how to read stock charts and when you test your trading methods and strategies. But finally you should use some professional tools and it does not mean that these tools are expensive.
Here are some practical tips regarding free online charts and some good features that you should check if you use free online stock charts. Another ideas provide some hints where to find good online charts and why to avoid interactive charts and 3D stock charts.
Bullish and bearish charts
Trend trading is quite good trading technique. It uses trend analysis and definitions. I personally use these methods for my trading strategies too. Here are some stock chart reading tips how to find if the market situation is bullish or whether we see negative, bearish trend charts.
Historical long term charts
Monthly and weekly charts should be included into your chart analysis routine. The recognition of support and resistance in larger time frame is very important.
Historical stock charts are important part of any analysis used by swing and position traders. You have to find good source of historical stock price data.
Find more on related pages
- Explore steps to start trading stocks, Forex, futures, CFDs and other instruments
- How to setup end of day trading software database
- Gather also further know how of simple stock trading