This is candlestick tutorial based on personal knowledge of more than ten years trading the stock market. It covers all simple secrets that lead to creation profitable stock trading strategies. Of course, you can use these ideas also to trade futures, commodities or forex.
Candlesticks represent simple but very good way how to read information about stock price development. Although there are a lot of different way how to interpret these simple rectangles you see on the computer screen, you should know the basics and select the best know how about them.
Candlestick reading
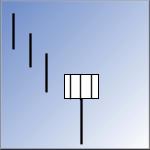
Every single candlestick is important for analysis of current situation you can see on the computer screen in front of you. They can indicate some important price action, like the breakout of an important support or resistance level. Single candlestick show also reversal point and you should know how to read their warning signals.
Many single candlesticks can serve as good base for bullish reading and bearish reading of stock price situation.
Candlestick patterns

Candlestick charts
Good analysis should be done using good stock charts. Candlestick stock chart is ideal option for easy a simple analysis. But it is important to set it correctly. You should use effectively your computer screen as it is the place from where you gain important information about a situation.
The first step is to decide when it is better to use candlestick charts and when you can use also other chart style.
Next step is to setup your japanese candlestick charts correctly.
Candlestick trading
Bullish candlestick patterns trading use the informational stregth of a single candlestick and combine it together. There are patterns based on two or more candles. There are many of them and it pays to know what are the most profitable ones. Bullish patterns helps you when you prepare bullish trade.
Bearish candle patterns are the opposite. They gives you green lights for trading the bear side of the market. Downtrend or bear market can be found on many stocks or indexes during every year. It is good to have tools to indicate the opportunity and trade it for profit.
Timing of the good trade entry isn’t easy task. You can analyze situation using candlestick stock charts to be better prepared.
Find more on related pages
- 3 tips for best Japanese candlestick charts reading and trading
- How to trade stocks with double and triple bottoms stock chart patterns
- Collect more ideas about simple stock trading