The trading pullbacks strategy uses a trend move that offers a correction. As you may know, the pullbacks are quite often found in an uptrend since stocks need to rest during a rise. A similar rule is valid also for downtrend moves. A short, small pullback counter-rise typically follows every sharp decline.
These pullbacks often offer an excellent opportunity to enter a trade that expects a continuation of a primary trend. Preparing a low-risk trade setup is an essential step for every profitable swing trader. The well-prepared swing trade setup has three defined points. An entry triggers a price, a stop-loss price and the target price.
You have to set the target price as the last value of the three trade setup’s values, but it doesn’t make it less relevant.
Swing trade target using support or resistance
The simplest but the most accurate technique for setting swing trade targets for pullback-based setups is to find support and resistance areas. You have to find the next significant level of support for short-sell trades, or you have to find the next area of strong resistance for bullish, swing trades.
You should use a chart with a larger time frame than you use for your primary trading. If you use a daily chart to find opportunities and create a setup for your swing trades, then you will use a weekly chart for the target setting using this technique. If you buy and sell on four-hour charts mainly, then you’ll select a daily chart for this target setting method.
IDU ETF pullback swing trade strategy target setting example
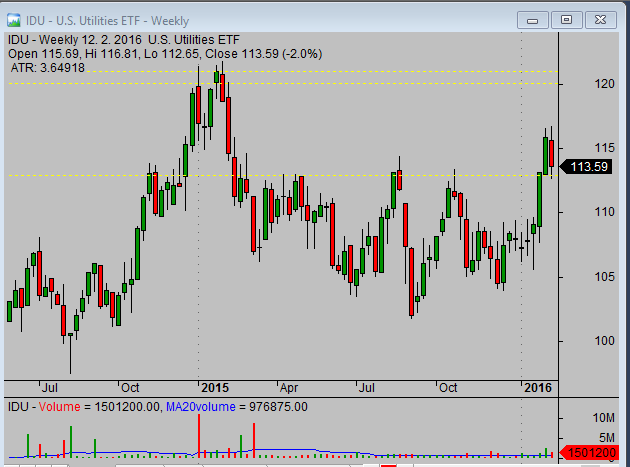
Here’s an example how you can see big target levels on a weekly chart.
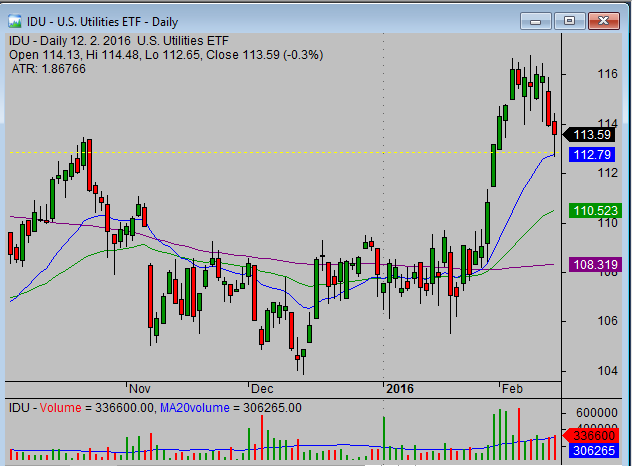
IDU, utility ETFs, made a breakout of a first resistance near 112-113 USD. A small pullback confirmed that the breakout is valid, and the price can start to advance again. What can be a target for the next price rise?
The weekly chart is going to help you to see the next significant resistance level. The $120 is an evident well-defined resistance as a 52-week high. You can expect the price will advance to this area during the next price move up.
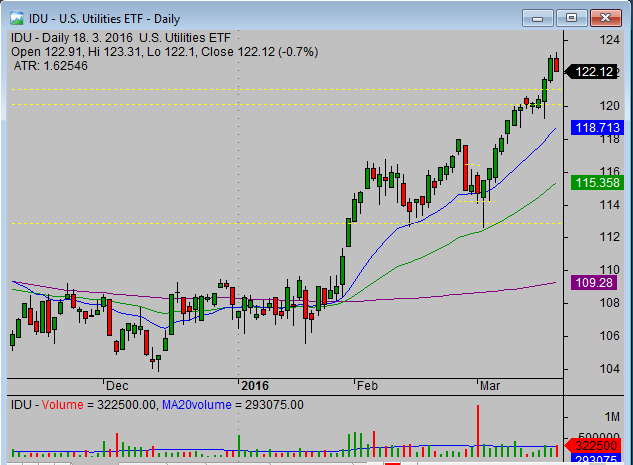
The final chart shows the situation after few weeks. The price spent a few weeks resting near the $113 support area; the price never dove below this former resistance—now support—level, and it confirmed its strength. And finally, the price started to rise only to reach the $120 -$122 area.
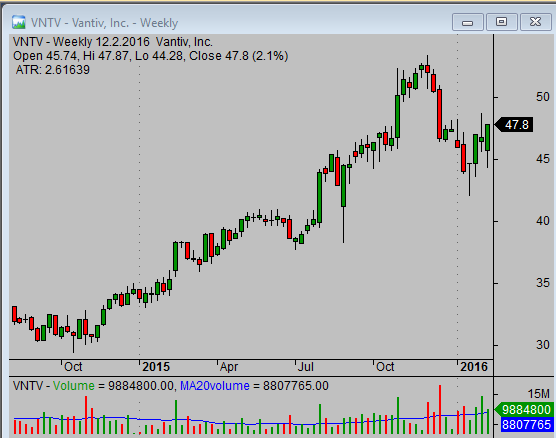
VNTV stock pullback swing trade target setting example
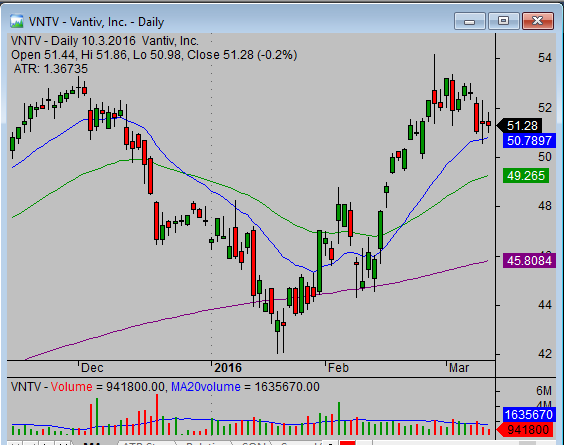
The VNTV stock pulled back from all-time highs reached at the end of 2015. The pullback pushed the price down to the 200-day moving average. The price found support in this area and started to move up again. The second bounce from the 200-day moving average showed strength and was a buy-able event. But what can be a target for a new rising move?
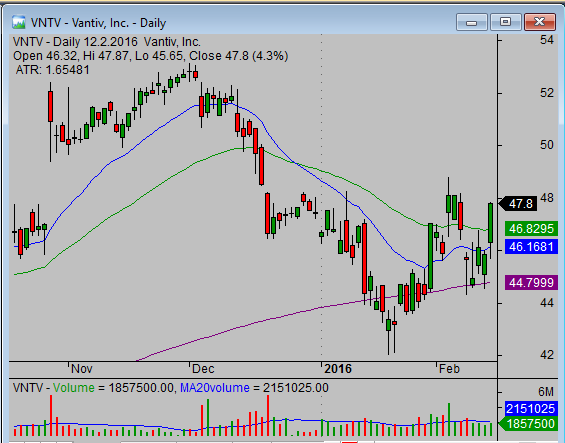
The weekly chart helps you again. An all-time high at 52-53 USD area can be the next significant resistance level so the price can move to this area.
As you can see on the next daily chart, the price really rose to this level quite quickly.
Learn this technique when trading the pullbacks strategy
The technique using the next important area of resistance for bullish trades or support for bearish trades is a simple but very powerful technique. You can implement it quickly when trading a pullbacks strategy on your account.
Find more on related pages
- Pullback swing trading strategy with Harami candlestick pattern
- How to short a stock in double top pattern strategy
- Explore more about stock trading strategies for swing traders