Relative strength analysis is a concept that many successful stock traders use. The power of this concept lies in the idea behind an analysis. And it is that relative strength strategy use info about big money players actions on the stock market. You can spot if they buy stocks in relative strength. A stock, that acts strongly, attracts buyers more than a stock that is weak.
But sometimes you have to compare relative strength for stocks in a similar trend. This is quite a common task you should do many times, and it is an issue for every swing or position trader.
You face this problem typically when you find two or more stocks in a similar situation like two or more stocks in an uptrend or two or more stocks in a downtrend. You have to decide what is a better opportunity for trading, which one you should prefer to another.
Relative strength analysis process video
You can watch the process you can do in this video, or you can read about it below the video.
Relative strength analysis bullish scenario
Relative strength analysis is the step you often do when you use a screener. After running a screener, you receive a list of several different stocks. You have to decide, which ticker to use and which one to delete from your watchlist because it is not as good opportunity as the first one.
So let’s start with an analysis of stocks in a bullish scenario. You can see that your watchlist is full of tickers generated by your bullish stock screener. You can see a typical example of a bullish stock pick on this FB daily chart.
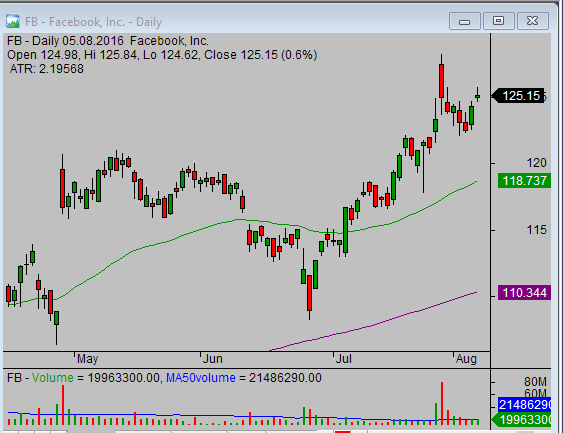
But you can have more tickers with similar daily charts. All have a nice uptrend on its daily chart. So how to decide, which one is a better opportunity and which one not?
Use weekly charts in relative strength analysis
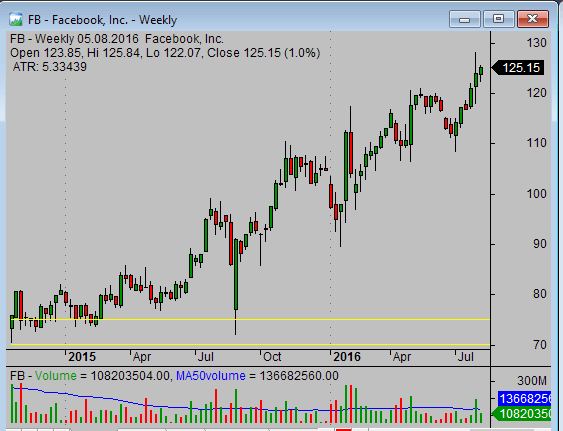
The first tip to simplify such decisions is to use weekly chart. You should use a chart layout where you have daily and weekly charts of the same ticker together. You can check the situation on a daily and also on a weekly chart. It is a situation in a short term period of four months and mid-term period like year and a half. So this is the first important tip that allows you to decide, which ticker is a better opportunity and which is not..
Support and resistance levels for relative strength strategy and trading
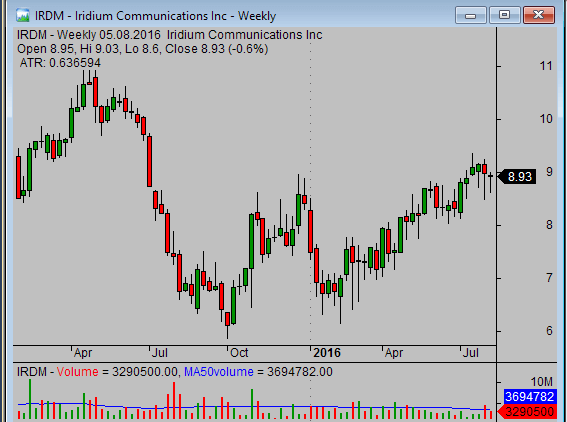
The other tip is to check a support and a resistance position. For example, you have Facebook as one ticker in uptrend, there is a nice uptrend also on a weekly chart, but you have here also a ticker like IRDM. It has also a quite nice uptrend on daily chart, so now its time to compare the weekly chart. And as you can see Facebook is very well in a strong uptrend and the price is on daily and weekly charts in the top right corner, so it is moving up up up, strongly up. There isn’t a strong resistance that you can see on a chart.
On the other side, in IRDM, you have a daily chart that is quite bullish, but when you check weekly chart, you can see, that the price is in the middle of the chart. IRDM is also in the area of resistance, so there is a limit for further uptrend move. You see this situation, and you have to decide that FB ticker is a much better trading opportunity than IRDM.
The similar comparison you can make with JCI. JCI daily chart has a nice uptrend but a weekly chart shows a different picture. The price reached strong resistance area around $46. It is not good to trade a stock that is in a resistance area because it will stop the movement. The resistance always tries to slow down the movement up, and stock can quickly start to move down or pull back from this level.
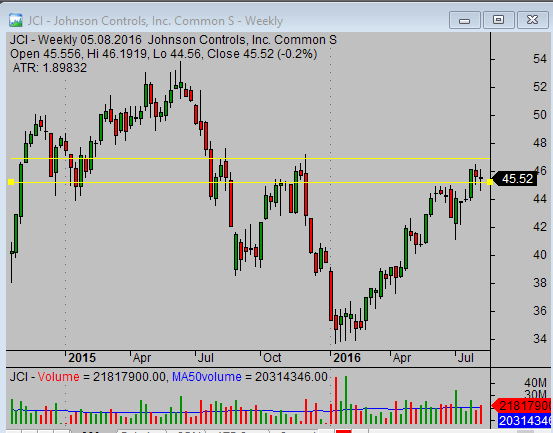
Again, you have to conclude that Facebook right now is a much better bullish opportunity than JCI or IRDM. FB stock price doesn’t face a significant resistance above current price level and it is the reason for your decision. You can expect another bullish movement up after some pullback. On the other side, for JCI, you cannot be sure until the stock breaks through this resistance area here, so right now JCI is not a good ticker.
Bearish relative weakness analysis
Similarly, you can check the bearish opportunities or bearish tickers, what can be a trading opportunity on the short sell side. You apply similar steps. Check both – daily and weekly charts – of tickers produced by your bearish stock screener.
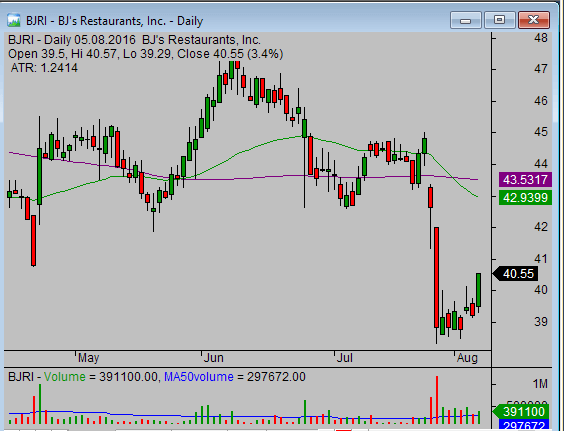
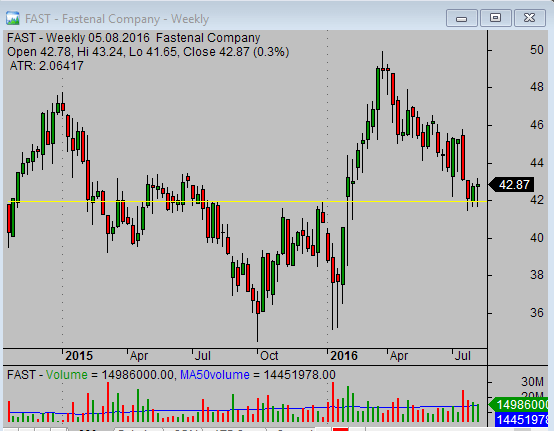
Here is one of the bearish tickers – BJRI. Its daily chart is quite negative. And the weekly chart shows the price broke through the support area and now is pulling back to this area. Compare BJRI with another bearish ticker, like FAST.
You can see the price is in the middle of this weekly one-year price range and reached the support area. So from this point, you should prefer BJRI to FAST in the current situation.
And I’m sure you will find more examples in your watchlist as the automatic stock screeners often return many stock tickers.
Don’t underestimate importance of a long term chart in relative strength strategy
This description shows how you can apply the multi-timeframe view to check what is a good stock pick for your relative strength strategy right now. You can implement it immediately.
Find more on related pages
- How to use relative strength for technical stock market analysis
- Relative strength analysis in ETF trading system for short proshares etfs
- Evaluation of stock sectors using charts
- Find more tips for good stock chart analysis