If you are interested in stock trading, you have probably already heard about multiple time frame analysis for traders. Technical analysis using multiple time frames requires using more than one chart type. Swing traders use daily charts, position traders use mainly weekly or daily charts. Daytraders use charts of much shorter period in a range from 3 minutes to 4 hours.
You could think that a swing trader uses exclusively daily chart for his needs and a daytrader only charts of basic five minutes period. But it is not correct. The best and most successful stock traders use multiple time frames at once. There are several reasons why they do so.
Using multiple time frame analysis techniques for trade management
Using charts with different time frames helps you with these stock trading tasks:
- Finding ideal trade entry levels (main +lower)
- Planning your trade target (longer time frame charts)
- Finding and managing stop loss levels (Shorter time frames)
You need to precisely define values for your trade setup. An entry value, initial stop-loss area and target level.
You can have problems to find the best point for entry or stop-loss on your main time frame chart. So you have to check shorter time frames and see if it offers more clear price chart situation. A typical swing trader will use a daily or 4-hour chart as his primary analysis tool. He or she should also always check hourly chart since it can offer more precise points for the entry and stop-loss levels.
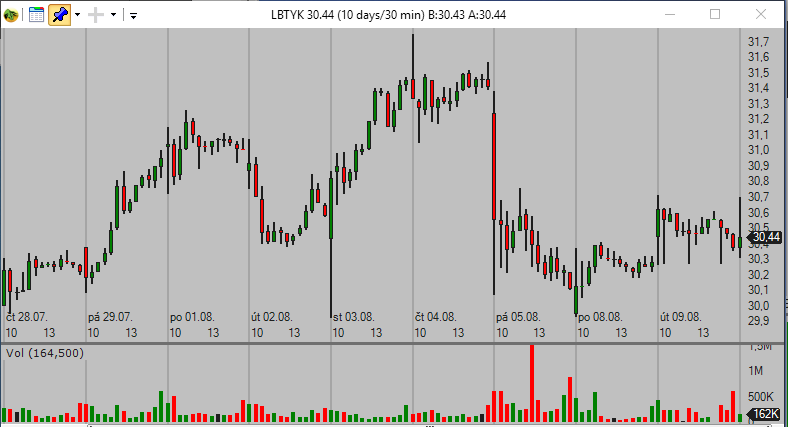
30 minute time frame chart
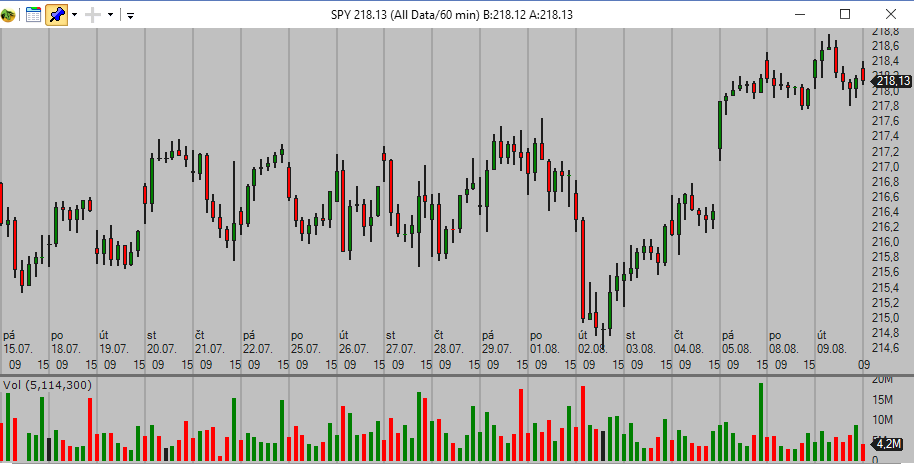
60 minute time frame chart
The next step is to set a trade target level or area. Swing trader will typically check a daily chart. But it can be messy or unclear sometimes. Longer time frame, weekly chart, will often show a more readable picture as it filters less significant support or resistance.
Setting and trading multiple time frames
You may wonder how many different time frames to use. First always remember that you should keep things simple to avoid overwhelming yourself. You have to stick to three different time frames maximum.
Optimal time frames vary based on your trading style. Daytrader will use different charts than swing trader. There are also different kinds of daytraders, some base their decision on the 3-minute chart some on the 15-minute chart.
You can find several examples of different multiple time frame trading methodologies in these articles:
http://www.simple-stock-trading.com/time-frame-selection-for-qqq-day-trading-systems/
http://www.simple-stock-trading.com/real-time-stock-charts-tips-for-swing-traders/
http://www.simple-stock-trading.com/the-best-stock-chart-time-frame-setup/
Chart analysis using multiple time frames
One reason why to use longer time frame – e.g. weekly for swing traders – is the possibility to see a more important level of support and resistance. Weekly view filters less important levels effectively and allows you to see where is really the strong area. It helps you make analysis and trading decisions more effectively.
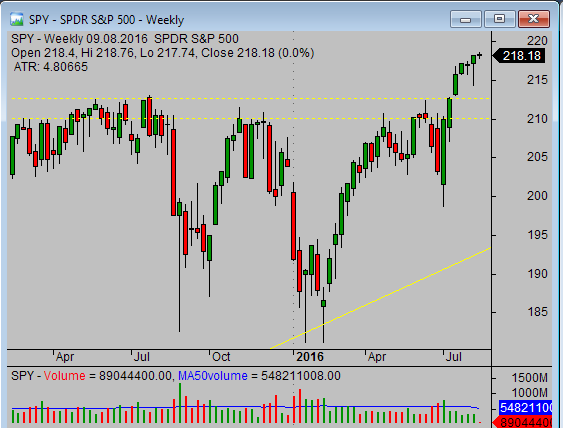
weekly time frame chart
Here are some article with tips for using weekly and long term charts
http://www.simple-stock-trading.com/how-to-set-stock-market-graphs-for-trading-systems/
http://www.simple-stock-trading.com/how-to-use-stock-market-charts-to-precisely-define-support-and-resistance/
http://www.simple-stock-trading.com/how-to-read-weekly-stock-charts/
Don’t limit yourself
You limit yourself if you use only single time frame period for your chart analysis and trading. If you start using more time frames, you can significantly improve results of your stock trading strategies and complete your trading system.
Find more on related pages
- Collect more stock chart reading tips