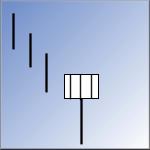
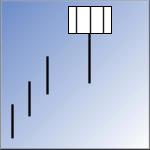
Every single candlestick provides you with a lot of useful information. You can use it to predict what could happen in the future. This knowledge dramatically improves possibility of big gains in every single trade you can make with stocks, commodities or currencies.
Major advantages of candlesticks
This graphic representation of a price movement is the basic cornerstone of almost every technically based trader and investor. Most of today stock charts are produced as a candlestick charts.
This graphic representation of a price move has several advantages against another form of charting the price. As you can read below they can provide you much more information about a price development and sometime also about a reason and an importance of such development.
And it could be the most important reason why is better to use this type of graphic representation of a price development. It helps you to decide if the signal you see on a chart is good and the trade should be executed or not.
Price and behavior analysis of candlesticks
Candlesticks can be painted on different types of charts. They are used on long-term charts like a daily, weekly or monthly but also on an intraday charts by daytraders.
The information provided by these candles is the same on all types of charts.
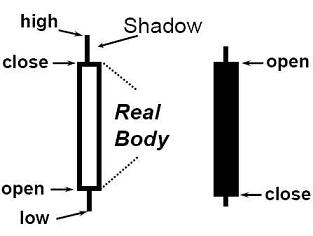
These shapes provide these price levels:
- Open – the first price in a specific period of time
- Close – the last price in a specific period of time
- High – the highest price in a specific period of time
- Low – the lowest price in a specific period of time
A period of every single candle is based on a time period of every individual chart. Intraday realtime charts are often based on 1-minute, 5-minute, 15 or 30-minute periods or sometime also hourly and 4 hours periods. Longer time frames are bases on daily, weekly or monthly periods.
And these main behavior levels could be found there:
- Buy
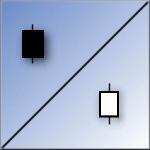
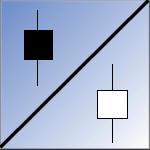
The candle is white, positive. That means the closing price is higher than the opening price. There are much more buying pressure in specified period and it moved price up. Buyers were in charge and it can confirm broader positive situation - Sell
The candle is black, negative. That means the closing price is lower than the opening price. Sellers were in action and they pushed price down. It could confirm negative chart situation.
Shape info
The shape tells you about the strength of emotions on the stock market.
Long body candles
A candle with a long body means strong buying interest (positive) or selling interest (negative)
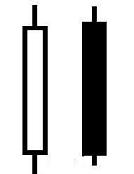
Short body candles
A candle with a short body means indecision. Buyers and sellers cannot win over each other. The last example below is known as a doji.

Hammer
A type of candle with a short body and a long tail means a possible change in behavior. If you find this kind of candle after several days of decline, then it indicates the decline might be over or will pause. The same applies for several positive days.
