Support and resistance are two basic stock trading terms you need to know for successful technical analysis of your charts. Learn how to identify these key price areas, and you will know enough to create a great system to trade shares.
Support is the key value area where demand starts to rise so much that it prevents the price from further decline. It’s the level where buyers go into action and start buying.
Resistance is the an area where supply begins to be so high that it stops the price from further growth. It’s the level where sellers find the price so attractive that they sell heavily.
Ways to find horizontal support and resistance
There’s no special custom indicator for identification of these values on the charts. These two terms could be represented by several different ways on your charts.
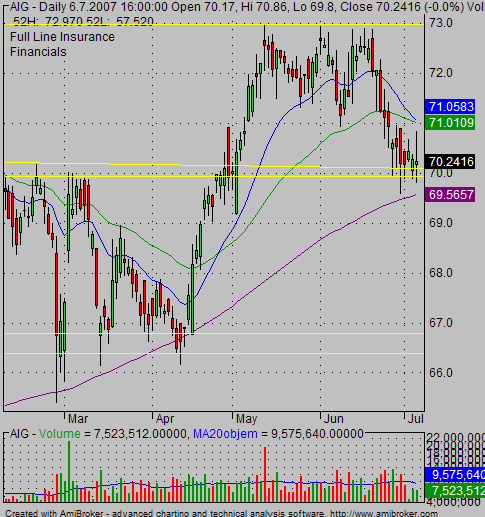
The most common type is horizontal price value as support or resistance. You can identify it simply by looking into a share history on a graph and finding the level where the shares stop its most significant moves. Check this example below:

My tip
Draw horizontal lines (as you can see above) to visualize the possible value areas. A horizontal level is much more a zone than simply one point. You can find short body candlesticks, doji candlestick or hammer candlestick on these levels.
Strength of these technical areas
Your chart could be based on different time-frame. As you can see on example above, the basic period is daily. That means that every candlestick represents one day. But you can define different periods also: weekly, hourly, 30 minutes and so. You are able to find these horizontal levels on any time-frame.
So, you have to recognize points that are stronger and useful than others, but again it’s very simple. Values from a weekly period are more important than sections found on daily period, and these are stronger levels than values from a 15-minute intraday period used by short term daytraders.
These levels can be broken
Nothing is forever. The same is with these price levels. So, every one of these levels can be broken. And such a break is a very powerful opportunity for a trade. Such break of these areas changes completely picture and opinion of investors and so it often leads to massive liquidation of old positions and accumulation of new positions in these shares.
Remember, these simple key rules for your strategy and analysis:
- Broken resistance is now the new support level
- Broken support is the new resistance level
Find more on related pages
- Identify what you should cover in daily technical analysis of stock market
- Inspire by this example how to trade gold etfs online
- Explore more profitable tactics of chart analysis