If you can understand when the technical stock quote charts turn into bearish mode, you have know how that could significantly increase profitability of your trading or investing strategies. This knowledge gives you an advantage for deciding when to enter positions and exit positions. There are two reason why is such a knowledge important.
Two reasons to understand chart bearishness
When you know that shares are in a bearish situation or present relative weakness, then you can decide to sell your long position and take profits without risk of a possible drop in the share quote.
The second possible outcome is that you can consider entering short sell trade in such shares with the expectation to generate profit from a possible drop in the price.
Best tools for analysis of stock market ticker
Reading of stock charts is not rocket science. You can prepare a simple chart analysis rules for your trading. Use only two moving averages on your daily charts. The decision about the bearishness of the market ticker is based on them.
The main condition for bearish technical analysis charts is that the price quote is under 50-day moving average (simple MA or EMA).
I personally prefer to use an exponential moving average in my chart analysis software, but the decision of which one to use is up to you.
If the price is also under a 200-day simple moving average then it is a much stronger bearish signal. You should not buy such shares for a bullish trade.
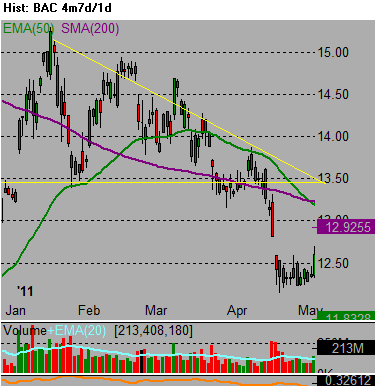
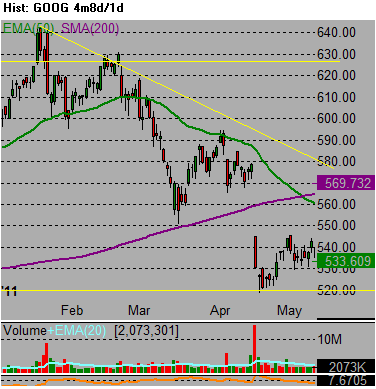
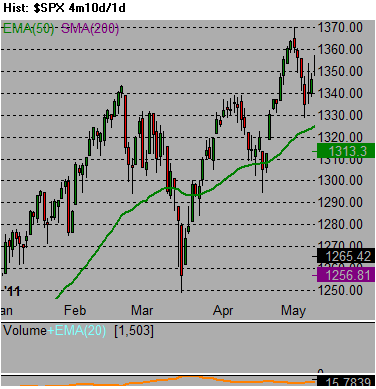
Here are examples of bearish technical price quote charts:


As you can see it was wise to avoid GOOG and BAC stocks. Active traders were able to find possible short sell trade setups in these stocks on these days.
Find more on related pages
- 3 tips for reading japanese candlestick charts
- Tips for bear stock market strategies
- Find out more about candlestick charts