Analysis of stock market charts is a very important task that should done by every short-term trader. The most important part of technical analysis of stock market charts is to find key price levels that are important for further price development. Stock market terminology names these key values as support and resistance.
The knowledge of support and resistance levels is very important know-how to trade stocks profitably. The basic definitions of these two key stock market trading terms can be found on many pages. But what is more important is the method or techniques to find and define these levels on the charts.
Use long term stock charts
The finding of support and resistance can sometimes be a tricky issue. Usage of only one time-frame with market graphs may not be enough to find the proper level of support or resistance. It could be hard to define exact support or resistance level using daily price graphs only.
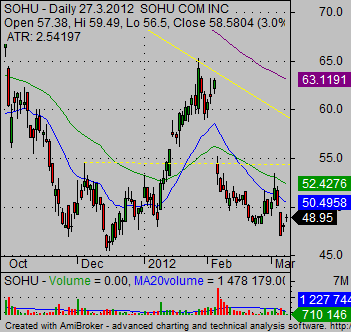
The SOHU daily chart signals that there is some horizontal support level. But it is hard to see the exact value of this level on this daily chart time-frame.
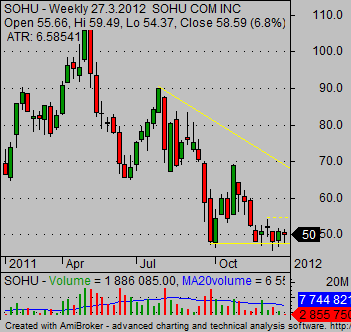
It is much better to use a weekly price chart of SOHU. Now we can see horizontal price level much better. The open/close values are much more important for precise determination of horizontal support level value.
Amibroker, my charting software, also helps in this task as it automatically copies horizontal trend line I created on a weekly price chart to daily graph time-frame.
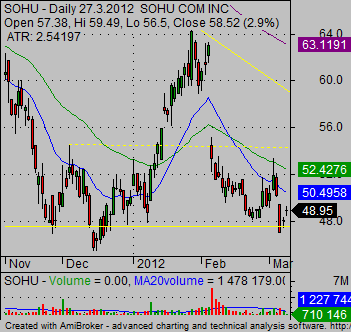
Now it is much easier to see the market situation on a daily graph. Horizontal price area is easily readable for any stock market trader or self-directed investor.
Usage of long term charts when setting target for your trades
Weekly or monthly long-term charts are also usable for a situation when you are already in some stock market trade and you cannot see a possible level of next resistance. The knowledge of this level is very important, as it can define target price for our trade.
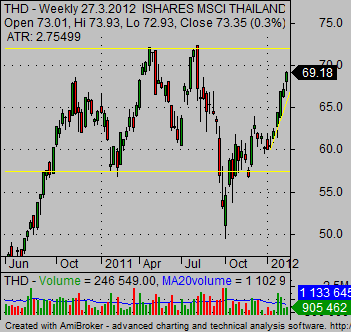
Here is an example of the THD daily chart. The breakout trade that was entered after the breakout of the 64 USD resistance area is now in progress. But it is good to know where you can expect that price movement will slow and where the uptrend could finish.
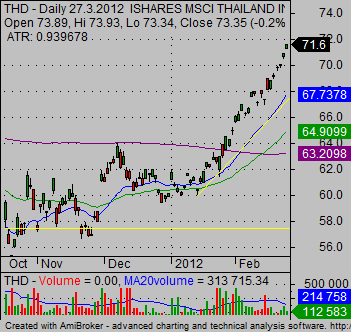
Weekly time frame and weekly technical graph could help. You can see some resistance area back in history near 72 USD. So a target for this trade should be near this important horizontal value area of resistance.
Set your stock market charting software accordingly
The use of multiple time frames is key for profitable trading. My recommendation for every trader or self-directed investor is to be familiar with use of more than one single time-frame. The best way to see all important support and resistance areas is to set your charting software to show short-term and long-term stock market charts at the same time.
Such multiple time frame setup is a bread and butter of every stock trading strategy that uses technical analysis. I personally used several different setups of multiple charts in my charting software for my online trading strategies. The best results were provided by a setup that shows three major time frames of single share ticker at the same time.
To be able to see more charts together I recommend using trading computer equipped with multiple monitors as the space presented by more monitors could be more effectively utilized.
Find more on related pages
- Two examples how to use Fibonacci retracement for stock trading
- How to set the best stock charts online or in your software
- Check another options of chart analysis