You should use best stock charts and set them into the best layout to gain more money from your trades. Your intraday charts as well as daily or weekly charts should be available in the form that allow you to make right decision about entry or exit for any of your trades.
Analysis of market situation and price graph for any market symbol is key for profitable results of swing or position trades. The situation should be well readable on your charts.
How to set stock index charts layout in your analysis software
First you will want to check market index charts to see the big picture. For US markets you should check charts of the Nasdaq Composite Index and S&P 500 Index. These two indexes cover almost the total US stock market space.
You have to set up historical stock charts for analytical purposes. You have to see major support and resistance levels and whether the stock market is in trend or not. It means that you have to see more than one time frame.
The best way is to set three different timeframes to see more than your main time frame. The main time frame is based on the type of your trading, it can be daily for a swing trader or weekly for a position trader.
If you are swing trader or position trader, you have to set index charts into these three time frames: Daily , Weekly and Monthly. This allows you to see major support and resistance levels.
Please understand that recognizing of support and resistance is core know-how for good technical chart analysis.
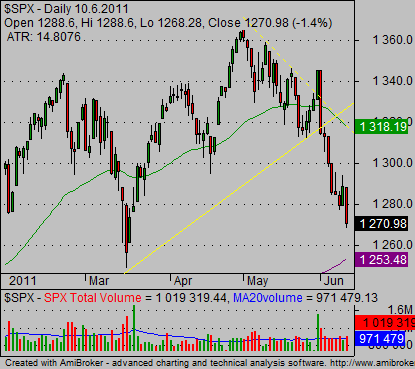
Here an is example of typical daily chart:

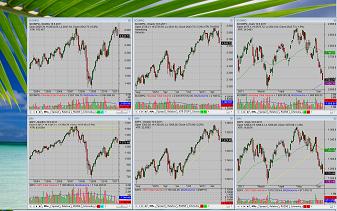
Example of best charts layout for analysis of stock market indexes
Here is a screen shot of my monitor where I have set all major market index charts I use for technical analysis.

As you can see on the charts above, I want to have them simple. I do not use too many indicators, I use candlestick charts. It helps me in my reading of stock charts procedure and make my life as an analyst, trader and portfolio manager much easier.
Watch this video about setting ideal chart layout
Best stock charts for shares and etf analysis
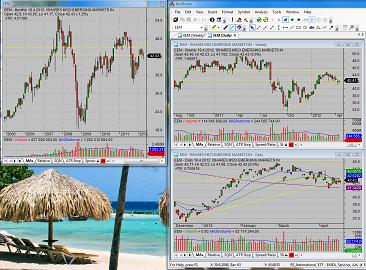
You should use a similar setup to put up the three best stock charts for individual stocks and ETFs. This is a picture of a layout that you can use for analysis of stocks or exchange traded funds. This analysis is a key step to find the best stocks or ETFs to trade for any trading day.

This is a layout for swing and position trading. There are daily, weekly and monthly charts on a single monitor. This set up allows to see all aspects of current situation and make correct decision what to do with any single stock.
Find more on related pages
- Online stock charts tips
- Understand how to read stock chart with more technical indicators
- Explore more details about chart reading