Six tips for profitable technical market research
This is a common question: “How to read stock charts?” This task could be complicated for some traders or investors. But the answer is simple: “It is not rocket science”.
Research of any market graph is often called technical analysis. The trading terminology used for technical research is a broad area. Here are the most important points you should know if you want to use chart reading in your trading.
Everybody can learn how to read stock charts
It is not complicated. You need only use common sense and basic principles of technical analysis. There are some key terms used in technical reading of a share price chart that must be followed. But learning how to read stock charts is not very complex and can be done in quite a short period of time.
Make easy to read stock charts
The basic rule is to keep the analysis of share price charts as simple as possible. Use candlestick charts with only a few indicators to make easy-to-read charts.
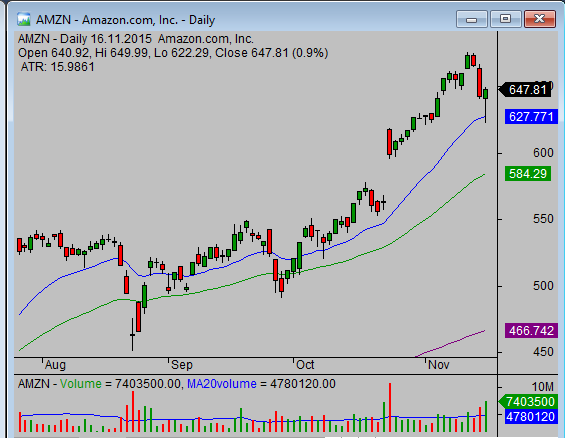
Easy to read chart example AMZN
Learn to identify support and resistance levels
Technical research of a share price has two main terms that are most important. The support and resistance levels are the two most important basics of good chart research. There are several ways to find them, but it is not necessary to use all of them. Just stick to one or two. It could help you to read charts more easily.
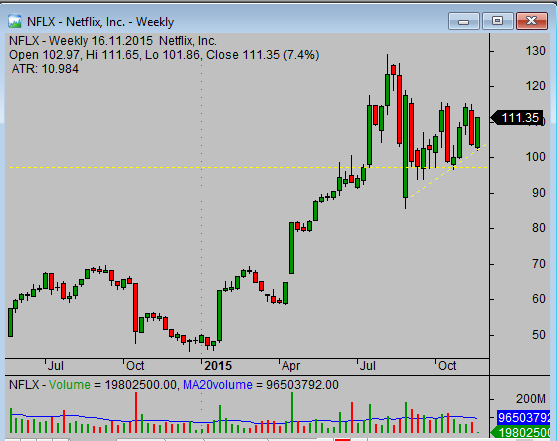
Price support on the chart of NFLX
Make easy-to-read charts and find these important levels using horizontal level techniques. A very good technical analysis indicator that can help is the moving average.
And finally, retracement levels also play an important role and could be accompanied in analysis of the graph.
Learn how to find trend using good analysis software
“Trend is your friend ” is a big truth. Do not fight the trend. So it is important to know what the current market trend is. The best trades are done when they are executed in some important trend environment like a bullish situation or bearish situation on the technical graph.
Learn to recognize stock chart patterns
Chart patterns help you find a good entry level, good stop loss levels and also possible target levels to make a planned trade.
Include stock volume analysis
Trading volume is a very important value that you have to monitor. Every strong move should be accompanied by strong volume. Strong volume moves are the ones with the biggest profit potential.
And now you have got all the important knowledge that makes it easy to read share price charts and analysis of actual market index situations.
Do you have any questions regarding the reading of price charts? Feel free to send me your questions.
Find more on related pages
- Collect knowledge how to find bearish situation on stock quote charts
- Explore why to use also historical stock charts
- Learn more about chart analysis