Many trades do not know how to make easy to read stock charts. Many trading mistakes are results of poor chart reading.
Reading of share price charts is often difficult and complicated for many traders. I am always surprised how some of them could complicate the technical market analysis that they perform on live charts or long-term charts. It is not easy to read stock charts for them.
I asked them to tell me what is most problematic for when reading a price chart. I found common points in their answers. I would like to address these points and stress some good solutions on how to avoid problems when using technical analysis.
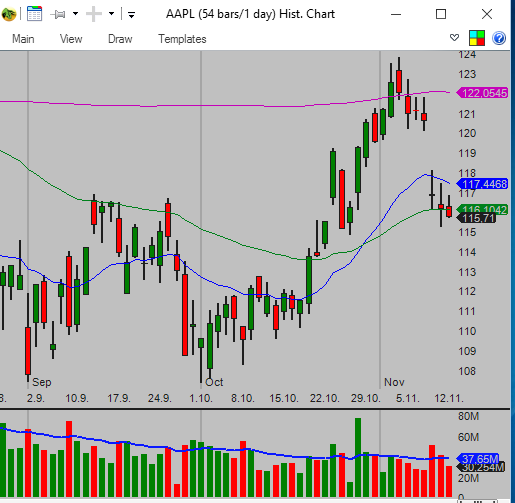
Simple daily chart
Common problems in technical stock market analysis
These points are the core issues that most traders and self-directed investors have.
- They use only one time frame
- They do not use candlestick charts
- Their charts are not readable
- They are not sure if the ticker will do what they expect
- They do not know what is the best stock to buy now
How to make easy to read stock charts
Here are details how to avoid these problems and stop creating trading mistakes.
They use only one time-frame
A lot of traders and investors watch only one graph. It is easy, but not such a good option for technical research. They only read a daily chart if they want to hold their position for days or weeks. Or they monitor only one intraday chart if they are daytraders.
They are missing the bigger picture. They are missing the important levels of support and resistance. I mention several times on my site that I have three different time frames at the same time on my screens.
They do not use candlestick charts
If you are a buy-and-hold investor, you can live with a line chart of market index and see if the markets and indexes are up or down. It is an easy task for them. But if you are an active investor or trader you must see more information on the chart. Use and read candlestick charts . Learn what candlesticks are and how to read them.
Their charts are not readable
They read and check only one chart, and it is filled with many indicators. They use several moving averages and a lot of different indicators like MACD, RSI, Wilders, Momentum, Bollinger Bands, OBV and a lot of more. It is useless. Most of these indicators are just some form of price formula. Keep your charts as simple as possible and read them more easily.
They are not sure if shares will do what they expect
Nobody is sure. Chart analysis helps to predict the possible future. But we are not able to predict it with absolute certainty. We can use historical graphs and real-time graphs to try to predict the future the best way we know. But as it is not for sure, we must use risk reward ratio, stop loss limits and other money management tools.
They do not know what is the best stock to buy now
I am not sure which is the best one. It would be easy to trade with this knowledge. What I can do is select some group of tickers that can be best buys. This stock and ETF list offers the best risk reward ratio. These stocks and ETFs have the best chance to move in my direction. It is important to be selective.
And making the final decision will be hard. You have to do it yourself. What can help you is if you have your trading strategy tested by paper trading or real trades with small amounts of money.
Watch the video how to setup easy to read charts in your analysis
Find more on related pages
- Two reasons to perform stock market trend analysis
- Improve reading of stock charts
- Learn more details about chart analysis