I use the following candlestick patterns for day trading almost every day. Intraday trading with candlestick charts is part of my complete stock trading business. Like everything in my stock trading, I learned to find simple basics that provide the best results.
Reversal candlestick patterns
The first profitable candlestick trading pattern is a reversal. Two candles create this candlestick pattern. The first is going in one direction, and the second one completely reverses the previous move. The result is that the move often continues in the direction of the second candle.
You can see this situation on the AMZN intraday chart below.
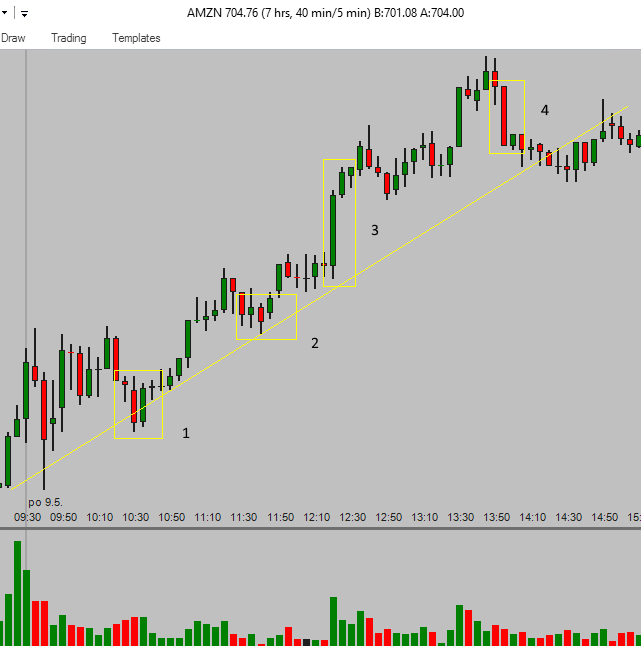
The first box indicates this situation. Sellers tried to push the price down, but buyers stepped in and reversed this move. It indicates the strong interest in buying. If you monitor this ticker for a bullish day trade, then this is a hint that new uptrend move can start soon.
This situation also indicates a support level or confirms this level as a support area. You can use it as a point to create a trendline, or if this situation happens on a trendline or a horizontal support level, you know there’s quite a good chance this support will hold.
It’s better to use this candlesticks pattern in an uptrend and not in a downtrend.
If you plan to trade with a bearish strategy, then you can use the opposite version of this pattern, where the first candle is bullish and the second one is bearish.
Series of small-body candlesticks
The box number two presents a situation with different candlestick chart patterns for day trading. The series of a small-body candles that you can see after several minutes of the strong uptrend is good. It indicates the price needs to rest for some time but that the trend stays intact. The buyers are not selling; they hold the position. The pullback is quite shallow. A volume is often light during this pullback.
The strength of this pullback series increases if you see it near the support trendline; this example you can see on the AMZN chart. These pullback levels can also serve as a good place for trailing your stop-loss level.
Strong trend movement
The third box shows a strong long-body candlestick. Your trading bullish strategy here is that you should be in the trade already when this happens. This important candlestick trading signal confirms your trading idea. This movement often pushes your trade into a significant profit.
Use this price development to minimize your risk and trail your stop-loss level accordingly. You have to place a stop-loss just below the low of this long-body candle.
Powerful counter-move
The final box, number four, represents a situation that’s a warning signal for your bullish day trade. The long-body downtrend candle completely reverses the last uptrend move that happened a few minutes ago. This reversal signals that actual trend is coming to an end.
The best thing you can do in such a situation is to take profits. Take money from the trading table and congratulate yourself for this well-managed intraday trade.
The second option is to move the stop-loss much closer to the current price level. If you plan to hold this trade several hours or want to give it an opportunity to move higher during the rest of the day, use a trail stop-loss. This action will always minimize your risk and give you a chance for a further price increase.
Always keep a candlestick analysis for intraday trading simple
Trading with candlesticks is profitable for day traders. The major problem that affects results of many short-term traders is that they overcomplicate their pre-trade analysis. Avoid too many complications so you can make a clear decision that has a high probability of success. Profitable candlestick trading means keeping your intraday analysis simple.
Find more on related pages
- Find more about candlesticks for stock traders
- Collect details about strategies for day trading classic chart patterns
- Explore more trading tips for day traders