Hammer candlestick is one of the most important candlestick patterns that you can use for your trading. This single candlestick is used by many traders to trade stocks, ETFs, commodities and forex.
Hammer candlestick is considered as a bullish candlestick pattern. The meaning of this candlestick is especially important in uptrend. The price starts near top of the candlestick and then move down significantly. Then complete reversal in the price behavior happens and the price starts to rise again, often above opening price.
The image below shows typical shape of the hammer candlestick

Hammer candlestick pattern significance
This pattern has the biggest significance when it occurs in a pullback during an uptrend move. It indicates that buyers are ending their rest and start to buy a stock again.
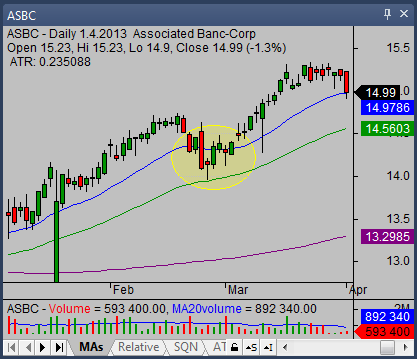
You should find this single candle when it is near some support level. Such level is often defined by moving average that serves as a moving support level during uptrend.
When hammer candlestick is found in the “middle of nowhere” then the significance of such occurrence is much lower.
Here is a chart with examples of this pattern when it serves as an indicator for reversal.

Here is a chart example of a pattern when is has almost no importance

Hammer candlestick confirmation and strategy
A typical trading strategy that uses hammer candlestick is based on trend moves. It is named a pullback trading strategy. It expects that the price is going to rise after this single candle pattern occurs at support level.
The first important step in this strategy is to recognize the uptrend in monitored ticker or instrument. The second step is to find a pullback in major uptrend move. Then you should wait if the required pattern occurs near some support level.
It is possible to use some stock market screeners that look for bullish stocks with hammer candlestick pattern. Such screeners can make search for good trade opportunity much easier.
The final step is to define good entry point for a bullish trade, the best stop loss level and possible target levels. These values combined help to calculate risk reward ratio for your trade opportunity. If this ratio fits with your trade system rules you can monitor the ticker and if your entry point is touched, enter the trade.
Here is typical stock pullback trade example for this hammer pattern strategy.
Stock trade parameters for hammer candlestick in uptrend
You should find the entry for bullish trade above the high of this candlestick. It means that you typically enter the trade during next few days after this hammer pattern occurs.
The stop loss level should be as close to entry as possible. The maximum stop loss is the price below the low of the pattern.
The target level for bullish stock trade in the uptrend is often set as a new high for this uptrend move. You should use charts with larger period – like weekly stock chart if you are swing trader, to find the next major resistance level. Target for your trade will be right under this resistance level.
Find more on related pages
- Learn about harami candlesticks
- Find ways to use Doji candlestick in stock trading
- Learn more from candlestick tutorial for stock traders