A cup with handle chart pattern is a bullish type of pattern. This type of stock chart pattern is relatively well known. It is quite reliable pattern for short term traders but also for active investor or position traders.
Cup and handle finds its usage in breakout stock market strategies. The stock spend some time consolidating in relatively wide range. The bullish bias is presented by final bullish pressure that can be seen in final half of this stock chart pattern.
This type of pattern can be found mostly on daily or weekly stock charts that are more usable for swing traders or position traders. Intra-day trader can find this bullish stock chart pattern on intra-day charts with periods like hourly or 4-hours period time frame.
The longer time frame the most reliability is represented by this cup&handle pattern.
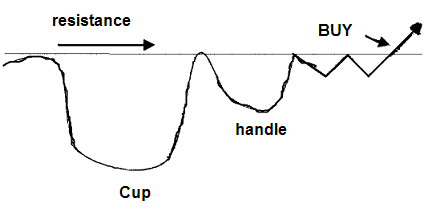
Classic form of this stock chart pattern
Basic form of cup and handle pattern is considered as a continuation pattern since it has the most reliability when it appears after some uptrend.
The cup and handle pattern represents price consolidation. A breakout of resistance should start a new uptrend.
Below you’ll see a typical design of the price development.

The cup and handle is quite similar to ascending triangles. You can use whichever definition you’re familiar with.
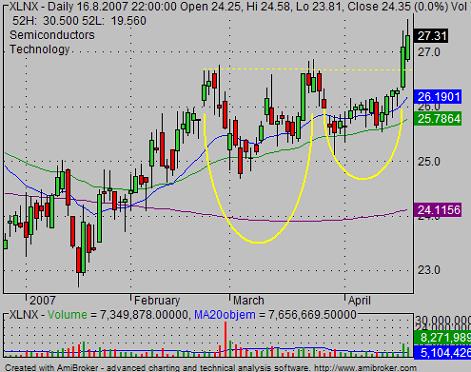
Another example on XLNX share price chart:

Inverted cup with handle
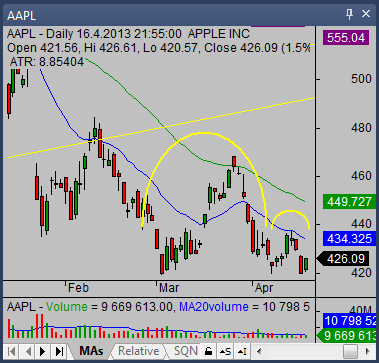
You can find also bearish form of this pattern. The inverted cup and handle chart pattern is also reliable and can be used. I personally have such bearish trading strategies in my trading system to be able to make money in bearish moves.
Here is an example of bearish inverted cup and handle on the AAPL chart. The important support line to watch is 420 USD.

Find more on related pages
- Identify how to find cup and handle stock picks
- View online stock charts tips
- Learn more how to analyze and trade chart patterns