Bullish candlesticks are important technical stock indicators that help us – traders – to make better trades. They are good for recognizing of positive reversal points in a bullish market situation and allow us to prepare the trade setups with the best risk reward ratios.
These positive candlestick chart patterns are useful in a bear stock market situation too. They help us to specify possible reversal points when it is good to exit a bearish type of trade – a short sell type of trade.
Investors trade shares on the markets and use their emotions a lot. Most of them are too much greedy or fearful. Trading market successfully means often to recognize current thinking of other investors.
A greed as positive emotion is not as strong as a fear. This negative state of mind is often overwhelming investors and they are sometimes panicking and selling their stocks. Therefore it is very important to protect your trade with stop loss orders and money management rules.
Best candlestick chart patterns for bullish trades
Bullish candlesticks patterns represent positive emotions of investors abouts share price. There are more buyers than sellers. You need to find these kinds of signs for the best stock you want to buy for a trade.
When I am waiting for a good entry point for a long bullish trade, I look for one of these two types of candlesticks with a bullish interpretation.
- Long, white body candlestick
- Big, lower shadow candlestick (like the hammer candlestick)
Here are examples of charts with these positive candlesticks.
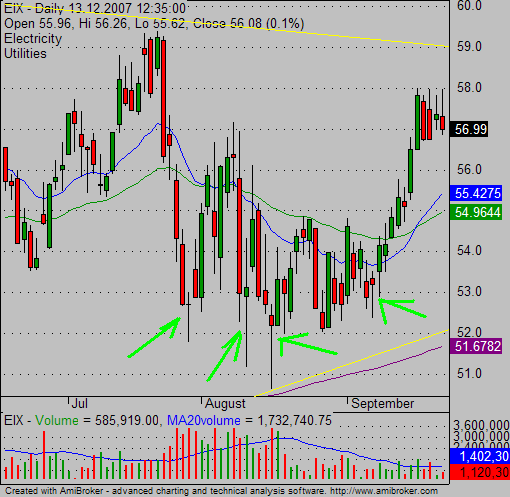
There are several bullish hammer candlesticks on this first EIX price chart in the support area 52-53 USD. They’re signaling a strong buying interest in this support area.

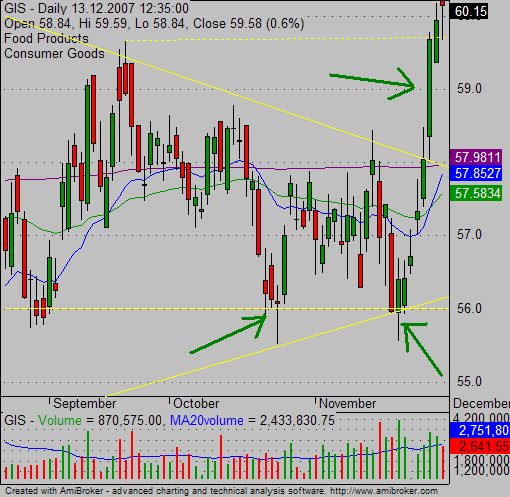
Hammer candlesticks on the second chart (GIS) are placed right on the support area defined by a horizontal price level and the uptrend line. The long green candlestick is making breakout – you need to enter a bullish trade during this day.

Use volume to confirm positive sentiment
I use a volume analysis a lot in my trading strategies. And so I have a recommendation for the candlesticks analysis. When bullish candlesticks are accompanied by a larger then usual volume then it gives you an additional confirmation of a positive development. There is a much higher probability of continuation of an uptrend move in near future.
Find more on related pages
- Learn also how to use bearish candlesticks
- How to trade stocks online with bullish candlestick patterns
- Read other chapters of this candlestick tutorial