Moving averages are a very popular technical stock indicators and a very powerful tools used in chart analysis. There is not complicated to use these averages as they are really very simple technical stock indicators. But it is their simplicity that makes them a very powerful trading tool.
Let’s start with calculation principle.
A stock chart moving average (MA) is a curve that is plotted to the chart. The value of the last plotted point is the average based on the last x values of the price. When you learn about 20 days MA, it means that it used the last 20 days for calculation of the last value.
The most common types of these moving technical indicators are simple averages and exponential average. The difference between them is only in the principle, that exponential averages also add weight to values. It means that yesterday’s value is more important than the value from the day before yesterday.
Moving support and resistance
The primary usage of this indicator is that it represents moving level of support or resistance
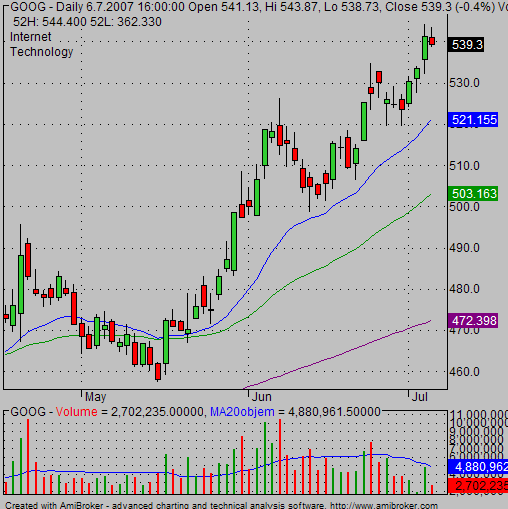
Look at the example below:

As you can see on this chart this indicator is represented with lines that are moving accordingly to price movements. They are representing natural and moving version of support and resistance.
These moving support and resistance levels are watched by plenty of traders and also active and fundamental investors pay attention to critical values like 200 day MA technical indicator.
Best values of this technical analysis indicator
To plot this moving technical analysis indicator on a chart, you need to define the period of the average. I like to use a 20-day exponential average (blue on chart above), a 50-day exponential average (green) and a 200-day simple average (pink).
Use type and periods you like, but these values (20, 50, 200) are the ones used most, and I find them good enough for stock chart analysis.
My chart analysis tips for averages technical analysis indicator
- choose color for your averages as you like. It will be much easier to analyze your charts when you will use colors that you can read well
- for a chart of a intraday trading system you could use shorter periods for averages (e.g. 9-day period MA). Daytraders should have signals on much lower level of intraday price charts.
Trend analysis with averages
The second important usage of this technical analysis indicator is that they can help you to identify trends.
This type of usage of averages is described on my pages about uptrend, downtrend, and trading range.
Learn to use moving averages for analysis of an actual market trend situation to make profitable trading and investing decisions.
Find more on related pages
- Gather more tips about using moving averages for swing trading
- Understand why is good to analyze weekly charts
- Read further about stock chart analysis