Trading triangle chart pattern is very good strategy for multi-day trades. Swing traders and position traders can use this pattern to increase probability of profitable results of their trades. You can do it, it is not complicated.
The first step to use this chart pattern is to find a set of candidates with this triangle pattern on their charts. It can be done by several different ways. The best way is to use automatic stock market screener looking for ascending or descending triangle chart patterns.
Online triangle pattern screener
The FinViz website offers very useful screener feature. Automatic pre-defined chart pattern screeners is one of its functions. It is possible to scan for many different chart patters. And you can find stocks with ascending or descending triangle pattern too.
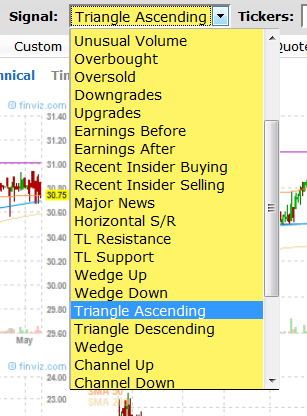
You can use this feature easily. Open FinViz web site home page. Select Screener from the main menu. Find “Signal” parameter and select “Triangle Ascending” for bullish version of this pattern. If you want to find bearish opportunities then select “Triangle Descending”.

Fine tune stock selection
This screener scans the entire US stock market. You should filter-out results that do not fit to risk management parameters for your strategies. You should include only liquid stocks with good average trading volume and also stocks with price above 5 USD. These two additional filters can be set on the page named “Descriptive” in Screener section of FinViz Page.
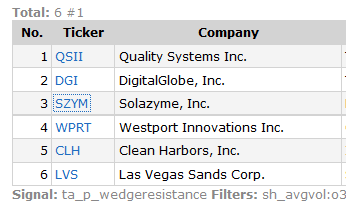
Here is an example of possible list of results generated by this screener.

You can export these results into Excel file and use it in your own stock chart analysis software for further analysis. Or you can select every ticker one by one and check the chart on FinViz site.
Scanning using your own software
Good analysis software package should include also screening features. I personally use Amibroker and it is quite easy to create filter or screener. You can scan the list of ticker located in your database for ascending or descending triangle chart pattern. The code is available in Amibroker online formula library.
Find more on related pages
- Lift your results with these techniques to trade triangle pattern
- Explore how stock index charts help you to make more profitable trades
- FinViz alternative – ChartMill stock screener
- Keep reading about stock chart patterns