Japanese candlestick charts are core charting style for many stock traders and investors. They are used in almost any trading and investing style – in daytrading strategies, by swing traders and position traders.
But not all of them use these candlestick charts the best way. Many of them use charts but in the form that is not well readable and so they have problems with proper analysis of the situation. These traders or investors then often make mistakes in their decision. Mistakes that cost them money.
Here I would like to share three basic tips that should help you to read japanese candlestick charts and make the most profitable decisions.
Set up ideal color for candlestick chart
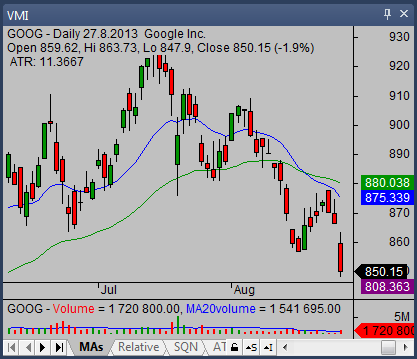
It is possible to use many different color combinations for your charts. I like to use light background with red color for negative candlestick and green color for positive candlestick.
Here is a typical example of daily candlestick chart I use:

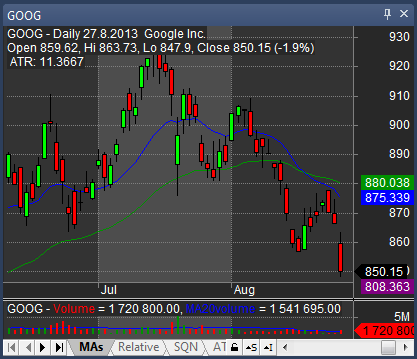
But a dark background is also option to use, like grey or black. These charts could be good setup for many stock traders.

Use more timeframes for candlestick trading
You should have more than one chart placed on your screen. Set up three major time frames that are the best for your trading style and strategy and place them all on your screen.
You will be able to see more complex situation on the chart with larger time frame and specific details on smaller time frame. This overview is very important for decision if situation offers good risk reward ratio for a trade.
Make your japanese candlestick charts readable
Many traders use very strange technical charts filled by many different indicators and so small that they are unable to read the situation well. You should define a minimal set of indicator and use it. Combining many different indicators often leads to confusion and indecision.
This chart indicator setup together with good density and number of single candlestick on one chart make a lot for profitable trading. It should be set in accordance with your monitor size and resolution but good start can be to use about 80 candles on a single chart.
Find more on related pages
- Tips to trade morning star candlestick pattern
- Identify bearishness on candlestick stock charts to increase trading profitability
- Learn more from the best candlestick tutorial