It is a big mistake done by investors who have never checked historical stock charts. Also plenty of traders who concentrate to short-term stock market price chart analysis and omit making analysis of long-term stock charts will make more errors in their trading.
Checking the historical chart stock market situation, actions and important price levels could provide valuable information for today’s stock market trading and investing decisions.
Historical stock charts could provide several important pieces of information about how a stock acted in specific situations like a bad earnings release, increase of major interest rate by central bank, decrease of such rate, debt problems, major bankruptcy and much more.
Here are tips how to maximize returns using historical charts in your analysis.
Check long term stock charts regularly
Do you check historical price charts regularly? I think that every trading or investing decision should be based on knowledge of historical share price development.
Why? There are plenty of reasons, but most important is to compare today’s market situation with the historical charts of the market situation back then.
It is old knowledge that should be imprinted into the head of every investor and trader that says: history repeats and repeats, and forget it at your peril.
Set up multi time frames for long term stock charts
So, based on this knowledge it pays to check the history of trading a few months or years back. Technical traders especially should use these methods and implement multiple periods into their chart analysis and use the historical chart type more often than not.
Historical price charts will help you identify major levels of support and resistance. I personally use three basic charts when I study historical share price market data.
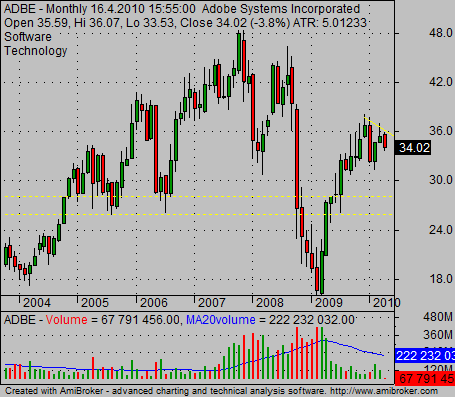
Monthly stock market historical charts
Monthly is the longest time period used by swing and position traders. Here you should monitor most critical levels of support and resistance only on the historical stock charts.

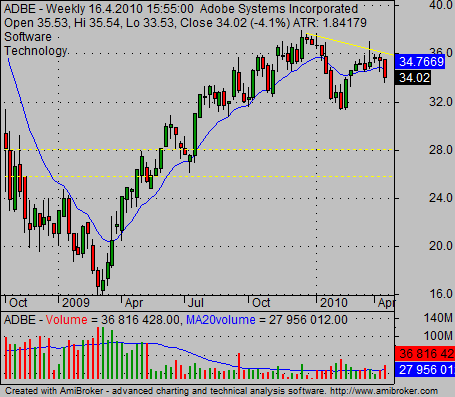
Weekly historical stock price charts
This mid-term period helps you identify good trading opportunities. Here you can see how share price acts near an important support or resistance level. It also signals the best possible values for a stop loss.

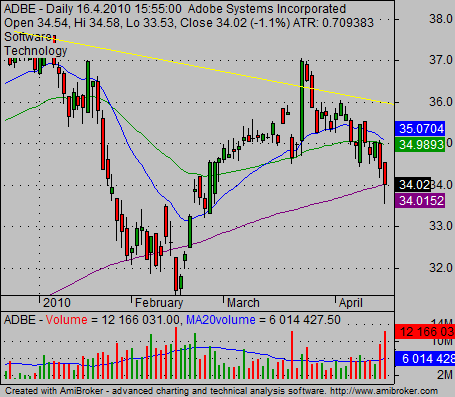
Daily time frame
This is shortest time frame for swing traders and position traders. Use it for precise selection of the entry point.

You should place all three charts together on one or more monitors to see all the periods together. It is always important to know major support and resistance levels from a larger time frame. Historical price charts are valuable tools for such analysis.
The types of historical price charts could also be determined by type of stock trading you want to use. If you are daytrader, it is probably not necessary to have monthly graphs but your long-term chart could be daily – if your main trade frame is one minute or an hourly chart.
But all these charts should be based on simple chart reading. If you want to use several indicator please organize them.
Find more on related pages
- How to read weekly stock charts
- Three lessons that must be taken from 1929 crash of stock market
- Continue to read more chart reading tips