When I am looking for possible opportunities for my ETF trading strategies I use top-down-type analysis. This analysis is based on simple method that is known as relative strength analysis.
But I have to have my list of ETF shares somehow organized to be able to do relative strength analysis well. The organization of exchange traded funds tickers I regularly monitor for possible trading setup is a key for good results of this analysis.
I basically divided etfs into several groups for analysis. First group is based on broad based indexes and other important market or index etfs that should be analyzed during my regular stock and etf analysis that leads to set of best trading opportunities. I start with a check and analysis of the current situation in broad-based indexes and then I move into sector analysis to find possible trading setups.
Group etf definition for analysis
Broad indexes are represented in my stock analysis software by these types of symbols:
- market indexes (like Dow Jones Industrial – $INDU,S&P500 -$SPX, Nasdaq Composite – $Compq)
- market ETFs (DIA, SPY, ONEQ, QQQQ….)
- for trading short side I use also Inverse market funds – Ultra short and leveraged funds like DXD or SDS.
All sector-based ETF stocks are divided into two groups for my stock chart analysis.
One group is defined as technology-based stocks. These ETFs use NASDAQ Composite as a reference market for relative strength analysis. This group could consists of symbols like : XBI, IBB, BDH, SWH, SMH, FDN. This list of ETF changes from time to time but some core stock market tickers are in my list of exchange traded funds several years already.
Second group is based on stocks representing sectors or industries related more to the “classical” economy. The S&P500 stock market index is used as a base market for relative strength analysis. This groups contains: XLB, XLE, XLF, PPH, RTH, TTH, WMH, IYR, IYT, XLP, XLI, XLU, XLY, XHB.
As I mentioned in previous group the actual list of etf I monitor changes from time to time.
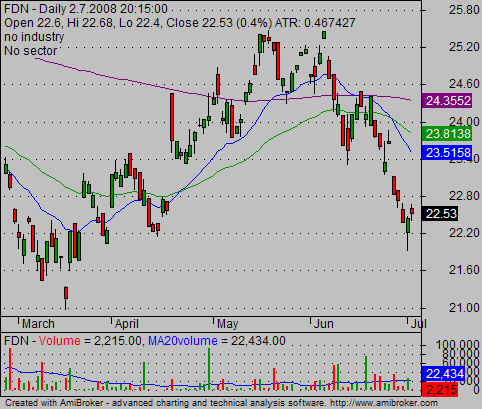
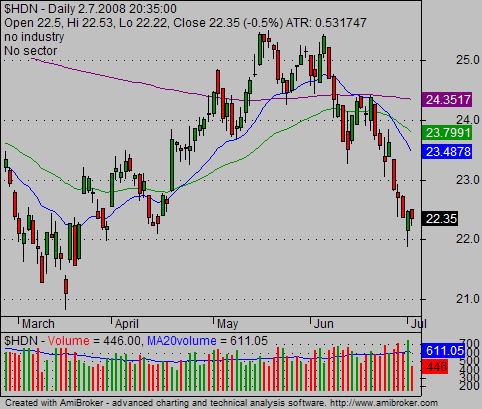
I chart the underlying index or NAV value for these ETFs. It means that I chart $HDN instead of FDN. It provides better-looking (cleaner) charts.


Key parts of good ETF trading system
My trading strategy for these exchange traded funds is based on this simple logic:
- define main market index trading trend
- find exchange traded funds that show more relative strength than the strongest market index.
- find funds stocks that are relatively weak to a weaker market index. This fund is then picked for a possible short trade with exchange traded funds.
I use simple techniques that provide superior results when I need to select best ETF for trading. The next part will describe using remaining ETF groups.
Find more on related pages
- Inspire by details about SPY ETF
- Read more about Reit ETF ishares funds
- Identify more opportunities by reading about ETF Trading strategies