Candlestick stock charts are a very useful tool for an every trader or an active investor. They have many advantages and one of the most important is ability to help you with timing of your buys and sells in your trading strategies.
This type of a stock exchange graph, which paints price movement using candlestick is more powerful than line charts or bar charts. Analysis of a market situation is more straightforward using this type of technical price graph.
When I think about a possible trade I must first decide what type of trade I can do with the selected shares. When the technical price chart tells me that the major market trend is up, then I want to find stocks with bullish candlestick stock charts. When the technical price chart is presenting a downtrend then I prefer to trade stocks with bearish candlestick charts.
Identify conditions for stocks buying
You can use very simple candlestick charts with volume and moving averages. Shares which you should accept for a possible bullish trade must have bullish technical charts. To simplify the process use a 50-day moving average and a 200-day simple moving average as two major indicators to define a bullish or a bearish situation.
The main condition for bullish technical charts is that the price is above the 50-day moving average (simple or EMA).
If the price is also above the 200-day moving average then it is a much stronger bullish sign and you can think about long trades with such stocks.
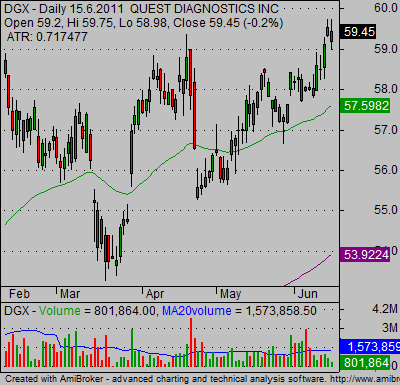
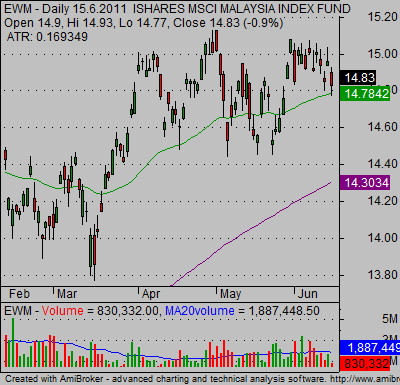
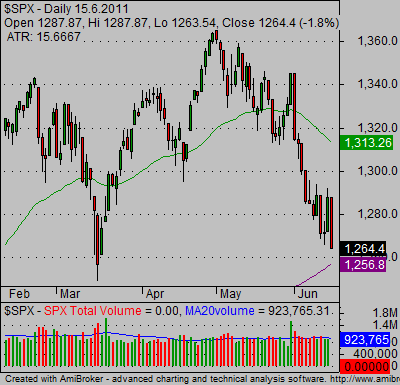
Here are examples of bullish candlestick charts:


It also helps that you can see a lot of bullish candlesticks on the technical price charts above.
The charts presented above are produced by Amibroker – the very good stock analysis software. But you can find also other useful programs for chart analysis. Finally there are also some good online websites that provide basic candlestick stock charts for your needs.
Find more on related pages
- Read why the single candlestick is also important for your analysis
- How to set up an ideal candlestick stock chart
- Find more in candlestick tutorial for stock traders