Setting stock quotes and charts in your stock market charting software could be little tricky if you’re just beginning with online trading and investing. But more experienced stock market traders could find it quite useful to think more about setup of live price charts and also historical charts in their market charting software from time to time.
The layout that you set in your stock market charting software will have a big influence on your technical analysis of price charts. Stock market traders that use small charts filled by plenty of information could have big problems with good charting and technical analysis even if they use the best charting and market analysis software they can find.
Stock charting software layout setup ideas for every-day trading computer
I recommend two basic ideas for setting up a good stock charting software layout. The first is to use more monitors, or if you want to use a notebook then use the type that offer a large screen. The best notebooks for trading are laptops with a large display, preferably a 17″-wide screen. Such a large screen offers almost similar space to two standard monitors attached to an every-day trading computer workstation.
Multiple monitor setup offers large desktop space that can be used for better charting setup that offers much better and more readable graphs. It is important to be able to recognize and analyze the market situation on historical and also live streaming stock market charts quite quickly and without the need to make these graphs larger.
It also allows you to monitor many different time frames for a single stock market symbol at once. It is very useful in charting and technical analysis. Such multi-time-frame charting software layout helps to recognize the two most important terms in technical analysis – the support levels and the resistance levels.
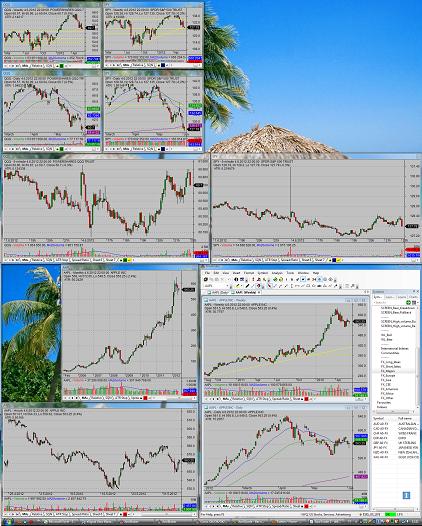
Here is my personal layout I use now (2012) in my charting and market analysis software – Amibroker – for charting and technical analysis. This layout setup uses two monitors placed one above the other. As you can see, my most important charts are quite large. I also use small charts on the top of the desktop space to monitor overall US equity market situation.

Keep your live stock charts simple
This is the base theme for my site and also my equity market trading methodology. Keep it simple. Simplicity helps in trading decisions and analysis. You need to absorb the smallest possible amount of information for your trading and investing decisions. You have to check and analyze only a small list of technical analysis indicators. Such charting approach is going to be very useful for your trading and investing activities.
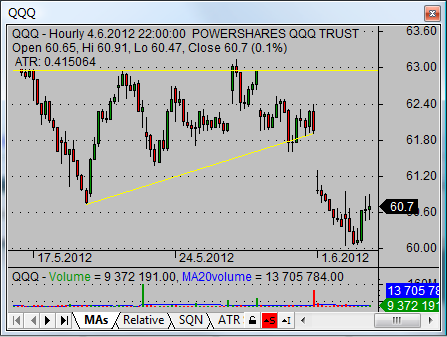
I know traders who use only simple candlestick charts with stock volume without any additional technical analysis indicator for their charting. This type of market trading strategy is well known as price action trading. It simply uses these basic market terms: candlestick charts, candlestick charts patterns, stock chart patterns and recognition of major support and resistance levels. It can also use some form of inter-market technical analysis where principles of relative strength and relative weakness are used. Stock trading volume is also used as the only one additional technical analysis indicator.
Charts for this type of analysis and for price action trading strategy look more like this example:

Stock market charting layout setup video
Find more on related pages
- Best stock analysis software for profitable technical analysis
- Ways and tools to improve technical analysis and stock charts accuracy
- Gather more info about market analysis software