The classic head and shoulders pattern is quite a popular chart pattern many traders use during many different time frames. Here’s description of an advanced technique you can use to trade bearish or bullish versions of this reversal chart pattern.
Head and shoulders is a quite reliable chart pattern because it often works well and trades often reach profitable goals. So, always learn basic trading strategies that are used to trade this reversal chart pattern.
But, if you want to have an edge in the trading head and shoulders bullish or bearish pattern, here’s a technique you can use, but this is an advanced technique, and you should have some trading experience to use this pattern profitably.
Bearish head and shoulders pattern chart
This is a daily chart of the GHL ticker. The price formed a bearish version of this pattern. The double top pattern created this head. So, you can see the two bearish pattern combinations. It’s always a good sign when you see combinations of two or more technicals that match your idea.
Click to tweet: It’s always a good sign when you see a combination of two or more technicals matching your idea.
You can see also the horizontal support area at the trendline near 38.50 USD level. Many traders will enter a bearish trade only after the breakdown of this support area. If you place a stop-loss above 40, and your target is near 30 USD, you can have a trade setup with good risk/reward ratio.
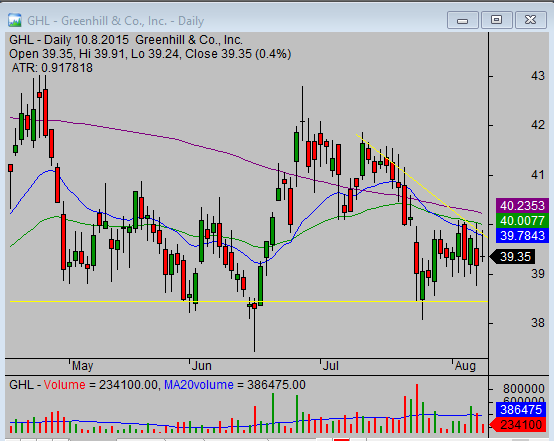
But, if you’re an experienced trader, you can already spot weaknesses when the right shoulder develops. Your trigger price for entry can be close to 39 USD with a stop-loss level placed above the 50-day moving average. The target are can be the same. You can expect a drop to 34 or down to the 30 USD area.
This setup will provide you with a much better risk profile.
Pros and cons of this stock trading technique for head and shoulders
The main advantage of this stock trade entry idea is that you’re already in the trade when the breakdown occurs. This earlier entry makes your risk/reward profile for this trade much better, and it allows you to make more money.
But this is a little risky entry since you have to wait to see whether the breakdown will happen. Therefore, it’s a technique that only experienced traders who can spot and evaluate a weakness fo the ticker should use when this classic head and shoulders pattern develops. It’s also important to evaluate the broad situation in the stock market.
You have to understand the concept of relative strength very well to trade this strategy profitably.
Additional entry points to trade this bearish chart pattern
This stock chart pattern trading idea also offers other additional entry points. You can use these points to add into an already profitable trade.
Adding to a profitable trade is one of the important way how to maximize profits in a trade that works well. (link to page with adding to a trade description)
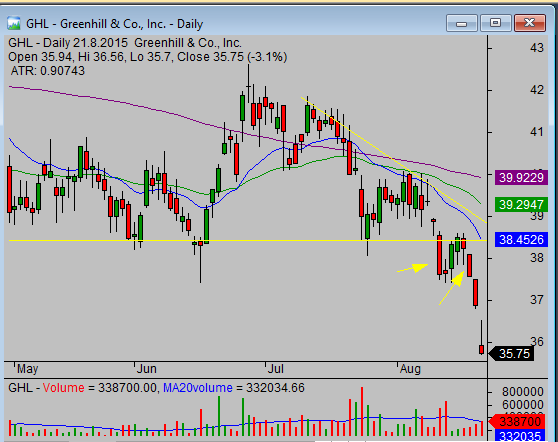
This second chart shows the situation after a breakdown. Two arrows point to two possible areas where you can add into the trade. These areas are also price levels, where traders who use the classic head and shoulder trading strategy enter their trades. So, they help you to push the price the right way.
Watch the video describing this idea for classic head and shoulders pattern trading
This stock chart pattern trading idea is a method that should be one of your trading strategies. Learn to use it properly and your gains from these trades will reward you.
You can find more details about this trading strategy also in this video.