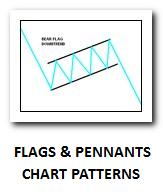
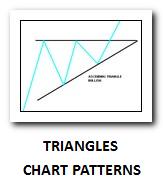
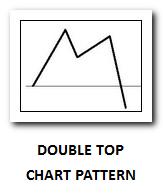
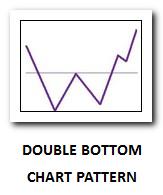
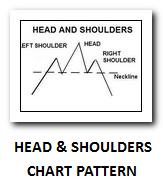
Analysis of stock chart patterns is important task for every technically based stock trader or investor.
They should be part of technical stock trading strategies for all time frames. Daytraders. swing traders and also mid-term position traders find them useful. It is recommended to have them incorporated into chart analysis and trading system.
It is possible to build your trading strategies on chart patterns only. Anyway it is important to know their pros and cons.
Continuation chart patterns
This type is often found in some trend moves during a consolidation period. The price rests after a strong trend move. They are very good for trend based stock trading strategies.
- Ways to trade triangle pattern
- Screening for triangle chart patterns
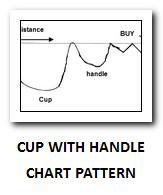
- How to find cup and handle stock picks
- How to trade cup and handle chart pattern
Reversal types of chart patterns
This group represents trend reversal periods. The stocks finished the previous trend and are preparing to enter an opposite trend period. This formation lasts longer sometimes than continuation type.
Ideal options for short-sell stock trading strategies. But they are also very usable for trades that expect the beginning of strong uptrend. Squeeze of short-sellers offer often very strong price move.
- How to scan for double top pattern
- How to short a stock in double top pattern strategy
- Find stock pick with double bottom pattern
- Stock trade strategy for double bottom
Best strategies for chart patterns
I like all formations described above. When I look into my trade journal software I can say that the most used patterns are flag and pennants and head and shoulders. It looks like I like these most.
More market strategies for chart patterns:
- Classic swing trading strategies used with chart patterns.
- Advanced techniques for traders using chart patterns
Find more on related pages
- Check also stock chart reading tips and lessons
- Keep reading about simple stock trading
