Short-term and position traders use technical stock charts a lot. They are basic cornerstones of these trading strategies. But active investors should also be familiar with using technical chart analysis.
As a swing trader you will use technical share price charts a lot. They are going to help you with decisions that you make for personal trading for a living. There are many ways to set these charts. I have tested several setups of technical stock charts. I used several different indicators and also checked several different ways to read any single graph.
Finally I realized the most profitable approach to technical analysis of share price graphs is to use SIMPLE charts. Since making this discovery I have started to promote simple usage of technical charts as it is the most profitable way of chart analysis.
Simple technical stock charts
When I started to learn how to trade I was actually creating my system and strategy. I decided to use a trading strategy based on technical chart analysis. But how could I analyze these technical graphs? I studied different books describing how to analyze graphs. I tested different indicators. Then I started to set up my technical charts.
I noticed one problem after some time. I was not able to make the correct trading decisions. Why? My graphs were too complicated. I had too many indicators on long-term and short-term price charts.
The whole picture was very messy. I was not able to read charts and make clear decision where to set up entry point, stop loss level and target level. I was also very distracted when I tried to manage trade based on chart analysis.
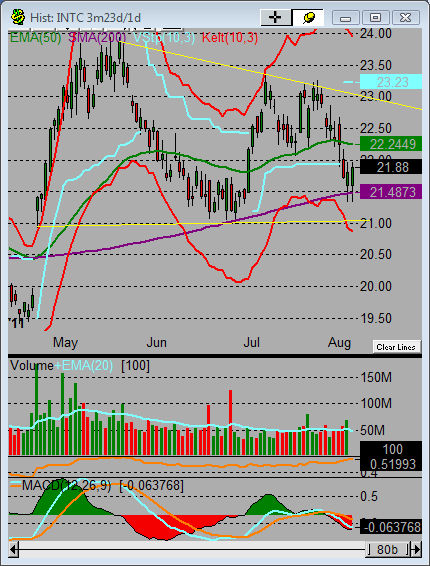
Look at this example of very messy technical charts I used before.

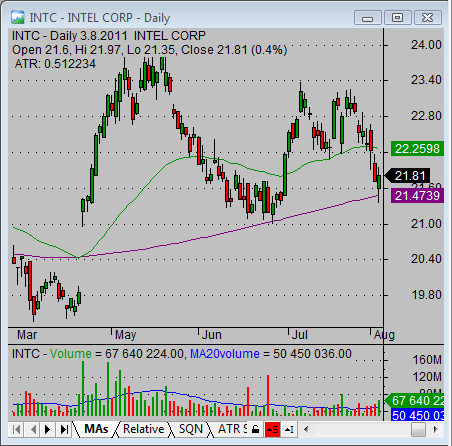
So after some time I decided to simplify them. I decided to take away some top indicators and some bottom indicators. I finally deleted almost every indicator on my chart. And these days I use this version of share price charts:

Set up correct colors for your stock price charts
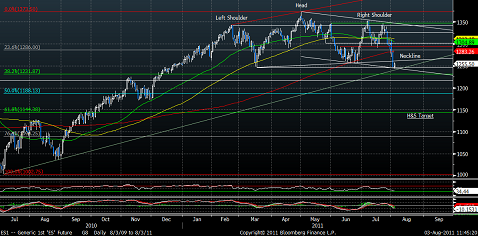
I have noticed that it is also important to set up proper colors for your charts. When your graphs are set in bad colors and also filled with a lot of indicators, then the result is very strange. I personally cannot use charts like this example I found on one financial blog.

Using technical analysis is up to you. You will decide which way to analyze you are going to select for your strategy. But I believe your needs will develop during your trading career.
Find more on related pages
- Understand basics of moving averages
- Best ways to use free stock quotes and charts
- Gather more chart reading tips and lessons