There are several profitable chart patterns. The simplest and easiest to use are flags and pennants patterns. Many technically based stock traders use them in their trading strategies.
These patterns are typically found using manual overview of different technical stock charts. It is the most common way how to find and identify these profitable chart patterns. When such a pattern is found, the trader manually draws trendlines that defines these patterns.
Online screening for profitable chart patterns
There is also second option and it is automatic screening the list of tickers for different profitable chart patterns. This automatic screening could be done in two ways.
The first is offered by several different online market websites that have also stock screening feature available for its visitors. I personally like the FinViz as the best one but this site doesn’t offer specific flag or pennant automatic screener. It offers the another set of profitable patterns for screening.
Another online website providing screening feature is ChartMill.com. Its screener has built in predefined function that can find stocks with Flags or Pennants.
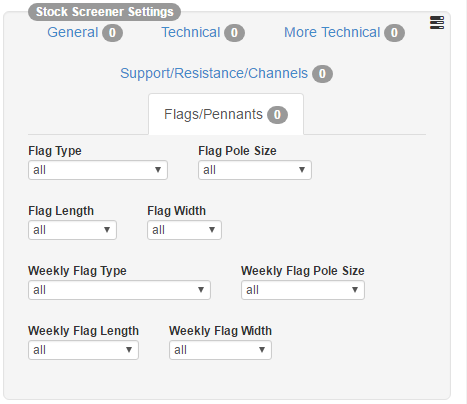
When I tested scan for bull flag pattern in stocks with average volume above 300K returned only five results as you can see below. But today it can be different. Check ChartMill.com yourself.

It is also possible to check small chart overview when going through this list. Very nice chart pop-up if the cursor is going over stock ticker in the results list.

Software for flags and pennants screening
You can use also your favorite stock chart analysis software, if it has screening function. My personal favorite, AmiBroker, has its own screening feature. It is possible to define your own profitable screeners.
When looking for good formula for such a screeners. I have found this description that is usable universally in any good stock chart analysis software with screening function.
// limit scope
[group is sp500] and
// rising market
[sma(200, close) > 20 days ago sma(200,close)] and
[sma(50, close) > 10 days ago sma(50, close)] and
[sma(50, close) > sma(200, close)] and
// falling prices recently
[sma(13, close) < 5 days ago sma(13, close)] and
// but not too much
[min(5, close) > max(5, sma(50, close))] and
// and price hasn't taken off yet
[close < sma(10, close)] and
// big volume not too long ago
[5 days ago max(10, sma(5, volume)) > 5 days ago max(10, sma(50, volume)) ] and
// but small volume now
[max(5, sma(5, volume)) < max(5, sma(50, volume)) ]
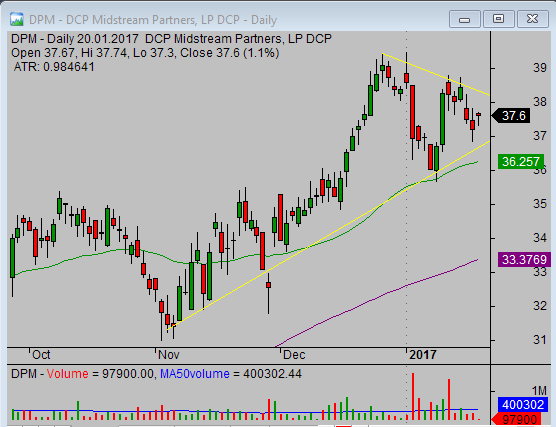
Check this example of pennant pattern on DPM daily chart:
Final tips for scanning
Although automatic screening could save a lot of time, it cannot replace final manual overview of the chart and the situation. You have to individually check every chart you found as possible profitable trading opportunity to make your own final decision if you are going to trade it. The preparation of entry point, stop loss point, possible target and checking of risk-to-reward ratio are next step in this process.