The bearish candlesticks and a chart analysis allow us to recognize a negative sentiment on the market. They are essential the stock market trading tools that help to recognize a negative, i.e. bearish, situation.
Investors often use their emotions to trade shares. They are not calm but too much greedy or fearful. Trading shares successfully means often to recognize current thinking of other investors.
The panic or the fear is much stronger emotion then positive thinking. You can see on many examples that shares were heavily sold during a panic. A panic selling is able to move a share price down very quickly. A bearish trend is much stronger then a bullish.
Importance of negative candlesticks on stock charts
Negative emotions are shown on the chart. Bearish candlestick patterns on a price chart represents bearish attitudes. These patterns can consist of one, two or more candlesticks.
Analyzing negative candlesticks during a chart analysis has importance for a decision when to sell you long (bullish) trade. They also help to define the best bearish trade entries in the bear stock market situations.
I personally think that for short-term trading it’s important to know these two types of negative candlesticks patterns:
- long black body candlestick
- big upper shadow candlestick
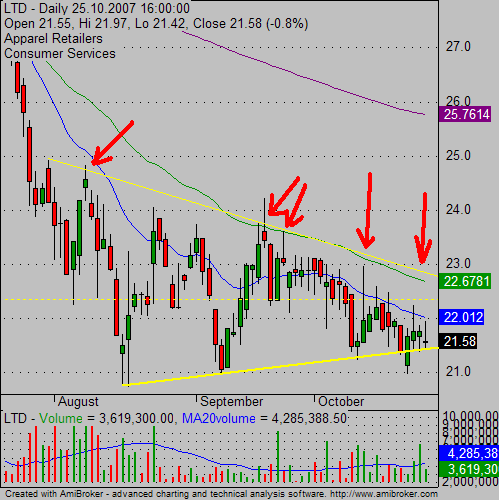
Here are their examples on two technical charts. This first chart presents that the price tried to go through resistance of a downtrend line and a 50EMA, but every time dived again under them. This is a really strong signal that the shares are under selling pressure. Also, notice the high number of long upper shadow candles on this chart – another bearish signal.

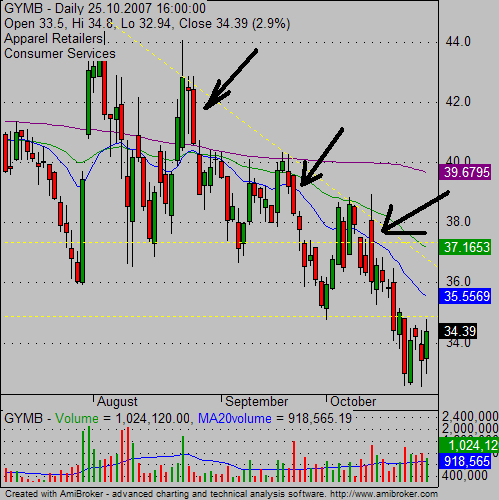
This chart shows how long red candlesticks developed every time the price touched a downtrend line.

Use volume to confirm negative sentiment
I use the volume analysis a lot in my stocks and ETF strategies. And so I have recommendation for the candlestick patterns analysis too.
When negative candlesticks are accompanied by a larger than usual volume then it gives you an additional confirmation of a bearish felling about the situation. It is much higher probability of continuation of downtrend move in the coming days.
Find more on related pages
- More about bullish candlestick patterns
- When to prefer candlestick charts
- Read more in the candlestick tutorial