Inverted head and shoulders is a bullish chart pattern. It is often used as one piece of technical trading strategies based on chart patterns. Traders and active investors use this reversal and bullish chart patterns in short-term and mid-term trading strategies.
The most popular usage of such inverse head and shoulders pattern is in swing trading or position trading strategies. It is possible to find this chart pattern quite easily on technical charts. It is also possible to use some free chart pattern screeners to handle this issue.
Inverted head and shoulders trade
I found several examples of this reversal pattern in my trading history. The first one example is a weekly chart of OCR stock. The price formed almost textbook example of inverse head and shoulders pattern. Horizontal resistance is at the 35.50 – 35.80 level. You should buy the breakout of this resistance area.

The trading setup should use entry point at the 36 – 36.25 level. The stop loss level has to be placed in the area of failed breakout. I placed it to 35.41.
The target for this trade based on this inverse head and shoulders pattern is near 40 USD level. These values of entry, stop-loss and target levels give us over 4 to 1 ratio of reward to risk. It was very good trading opportunity.
It happened at the beginning of the January. The price broke resistance and moved up during a strong five-week uptrend.

Trade management rules moved stop loss levels as price advanced and locked exit level in the profit area during first two weeks of this trade. The price finally moved very close to 40 USD level where the trade was finished. It is always better to plan exit just under the whole number (39.80) instead of wait for 40 USD. Great trade and nice profit.
Inverse head and shoulders in uptrend
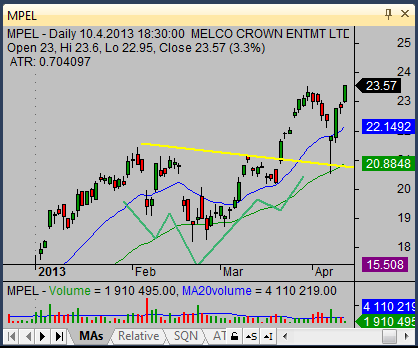
It is possible to find inverted head and shoulders pattern also in a pullback during strong uptrend. The second example shows the daily chart of MPEL. I drew trendlines to visualize this pattern.

The price broke the 21 USD level of H&S neckline resistance and quickly moved up to the 23 USD level. This breakout was a great opportunity for a short-term swing trade lasting only a few days.