Reading stock charts is not rocket science. It is much easier than you can imagine. But you should keep it simple and easy. Here are three major points that will help you to use the best stock charts for your trading.
First you have to set up your charts to be able to use them. I recommend using some good chart analysis software, which makes this task much easier. Good charting software is much more customizable than any web site, and will even offer the best free chart options. Individual short-term or long-term charts can be set easily and with more options in standalone charting software. Reading of such charts will be easier.
Three stock market basics for reading stock charts
Use candlestick charts
This is the best type for the chart analysis process. Candlesticks provide a lot of information about price action. They also allow better reading of support and resistance levels or reversal points. Candlestick chart patterns are quite good technical indicators of investors’ opinions and moods. It is possible to use them not only for bullish trades, but also for bearish trades.

Use only a few technical analysis indicators on candlestick charts
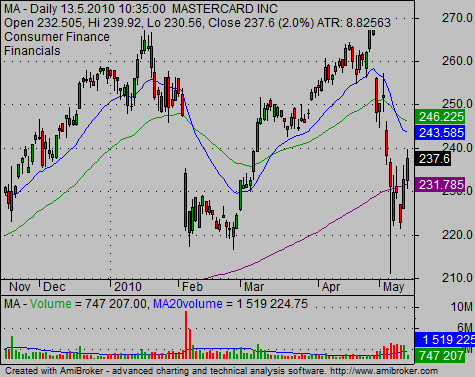
“Keep it simple” – It is a very big truth that you will hear from all good traders and investors. The simpler the approach to reading stock charts, the better the results of such analysis. Example of a simple candlestick chart:

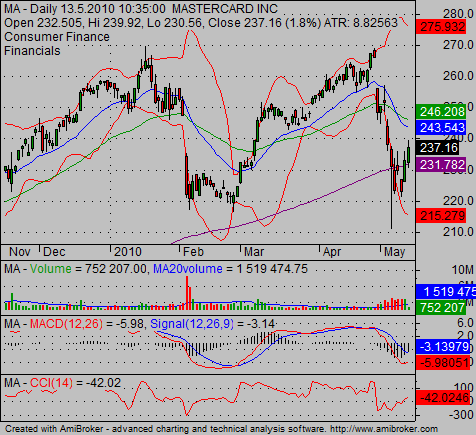
Example of complicated chart:

There are some options as to how to set up your charts if you plan to use several more technical indicators then I use. This feature is built into any good charting software for technical analysis. This feature is called TABS in AmiBroker software and helps a lot in the reading of charts and technical indicators.
Use more than one time frame and long-term charts
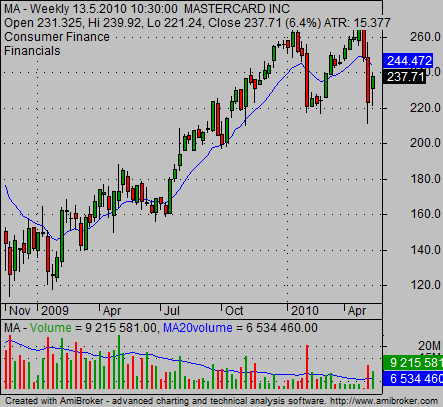
It is very important to analyze more than one time frame. Also, do not be afraid to use longer time frames like monthly or weekly time frames. The reading of these charts provides very important info about the most important levels of support and resistance.
Find more on related pages
- How to improve any stock market strategy
- Check this free stock trading software for stocks
- Gather more knowledge about chart analysis