Moving averages are very important tools of technical analysis. It is so powerful that is used also by investors who rely almost exclusively on fundamentals to create their portfolios. And traders use moving averages for swing trading, daytrading and other forms of short term trading with really good results.
The strength of this indicator lies in its simplicity and possibility to use it in different situations and for different purposes. If you want to make your trading results better you should master these ways to use moving averages for swing trading.
It can seems a little bit strange that I speak about different uses of one technical analysis indicator. How is that possible? Although moving averages are calculated the same way and they are drawn to the charts the same way, it is possible to use them in different situations and for different types of analysis.
Using moving averages for stock market mood analysis
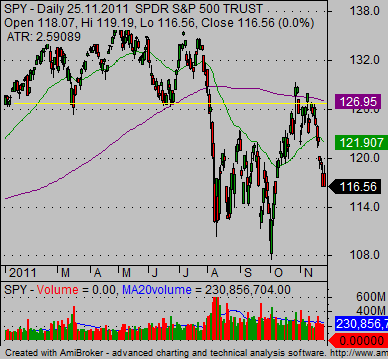
The first option is to use moving averages for analysis of the market situation. It is very important to know the current stock market mood. It helps to select the best swing trading strategy for stocks and ETFs.
It is not possible to trade using only one single strategy all the time. The market changes its mood several times a year and so every trader should be able to use different trading strategies for different market situations.
Stock volume analysis
This is also a very good use of moving averages as technical indicators. This technical analysis indicator calculates the average volume for a specific period. Then we can compare it with the latest volume and price development on the chart.
Low volume levels (very much below average) and high volume levels (very much above average volume) are important levels to watch. These volume values together with price development could indicate an important situation on the chart.
Support and resistance
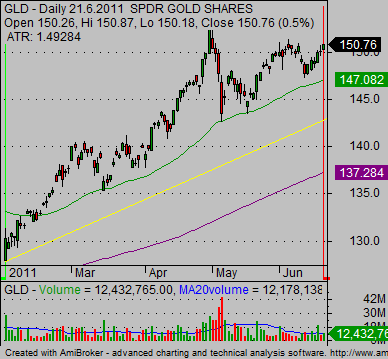
One important option to use these technical indicators is to use them as floating levels of support and resistance. The support and resistance analysis uses the moving average in two different versions.
The first one is when the value of the moving average coincides with another type of this level. It can be the horizontal support or resistance or some form of trendline. This gives a much stronger signal about such level, as you can see on the chart example below.

Another option is to use moving averages as a floating support level. It is useful in times when a price is in a strong uptrend or downtrend. This type of analysis helps to combine these levels with flags and pennants as continuation chart patterns for possible trade setup for the best online stock trade.

Stop loss level defined by moving avegares
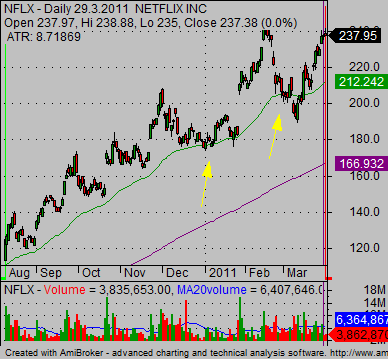
This options uses moving average as a technical indicator that helps to determine stop loss level in online trade. When stock is in a strong trend move then it often does pullback back to support or resistance level.
Moving average then serves as support or resistance as described above. Any significant break of this level could serve as a trigger for exiting of the online trade. And only usage or proper stop loss technique could lead to superior results of any best online stock trade.

Find more on related pages
- Check ways to use free stock quotes and charts
- Basic features of stock markets trading software
- Find the way to set the best entry point for your trade
- Understand key ideas of profitable chart analysis