Flag chart pattern is a typical pattern that can be found on price charts quite often. This type of continuation chart patterns is often used as a core technical stock market trade tool for position or swing stock market strategy.
The flag pattern is a fairly reliable pattern. It produces consistent results for traders in all markets. It can be used to trade stocks, for FX strategies and also for ETF trade strategies or commodity trades.
Basics of bullish stock market strategy for flag chart pattern
This stock chart pattern is typically used in bullish stock market strategies. It is a trend chart pattern. There is expectation for continuation of the previous trend. This pattern represents a period of rest that is needed after a previous uptrend move.

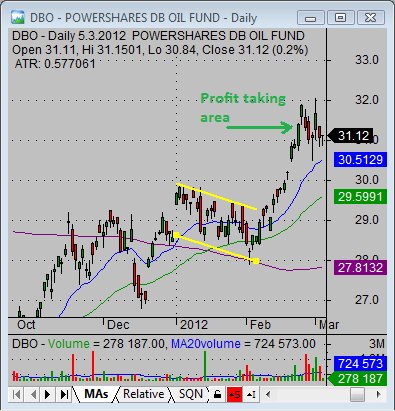
This first price chart of DBO – the oil ETF – shows that this commodity exchange traded fund experienced a strong rising trend that moved price above the 200-day moving average. This single uptrend move should be considered as a bullish signal that could be used for this commodity ETF trade strategy.
DBO – oil ETF – is now in the process of moving in small price range, without any significant pullback. The support and resistance lines of the flag chart pattern define this range.
Entry point for this bullish etf trading strategy
The entry point is located above the resistance of upper trendline of this bullish stock chart pattern. When price breaks this resistance, then you can expect that a new uptrend move has begun. In this case you could set the entry point to a level near 29.50 USD.
Stop loss level
The stop loss level you can set at your discretion. I personally think that price should not return back to this bullish flag pattern. The value right under 29 could serve as a good stop loss level.
Taking profits area
You have to plan how and where you will take profit in this trade. It is good to set some fixed target level. You can also use some form of trailing stop loss trade management technique for your stock portfolio position.
Based on the chart above I would set the expected profit target in the range of 31.50 to 32 USD.
Money management and Risk management
The values described above should allow you to calculate a risk reward ratio for the trade you want to open. I recommend achieving at least a 3 to 1 ratio for this risk management stock trading tool.
Other tips on how to trade flag chart pattern
I like to see stronger volume during the breakout phase. The above average volume confirms the breakout and makes me more comfortable with the trade direction.
I also like to move my stop loss level immediately under the low of the breakout candlestick. I want to see immediate follow up over the next days. The price should find momentum and rise.
Result of this flag chart pattern trade
The next chart describes situation during the entry phase of the trade as price moves away from the flag.

This third technical stock chart shows the situation where the trade was closed on the fixed target or our trail stop management. The expected target area was reached and we booked nice profit.
Find more on related pages
- Flag and pennant chart pattern screening
- Day trading strategy for pennant pattern
- Explore more options to make money using stock chart patterns