Double top chart patterns offer good opportunity to short-sell trade. Traders and active investors who know how to short a stock could make significant profits in this bearish style of trade. But you should have the detailed description of your short selling trading strategy before you make any short sell trade.
Typical trading rules for reversal top patterns
The most obvious trading rules say you have to wait for the breakdown of the horizontal support level of this stock chart pattern. Then, you can enter short trade and expect further weakness.
The entry for breakout short sell trade could be defined by many different techniques. I recommend to check the strength of support level and incorporate stock volatility or average daily trading range into calculation.
The stop-loss level should be above the support level. You can see this strategy was really successful in this case of NYX

Pullback entry for short selling stocks
You can also wait for the first pullback to its former support level, which acts now as a resistance level, and enter trade in this situation. As you can see, such a stock trading strategy was also possible for the NYX stock chart above.
This is little bit less risky approach to trading patterns like these ones. It allows to wait for test of resistance level and set entry and stop loss level much better then in breakdown trade type.
The one shortcoming of pullback strategy is that sometimes breakdown initiates strong decline without any significant pullback and so the whole down move in such stock could be missed.
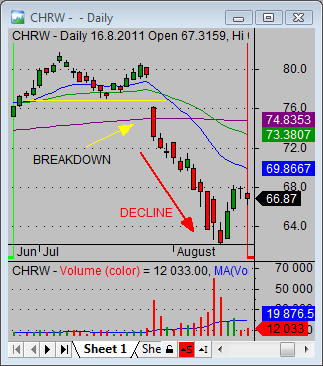
Such scenario is presented by this price chart of CHRW after strong breakdown of support level. The breakdown occurred by big gap associated with strong volume levels. This stock market trade was possible to realize only using breakdown type of strategy.
Find more on related pages
- Learn to find double top candidates for short selling
- How to use engulfing candlestick in trading strategies for stocks
- Learn more about chart patterns