Many investors and stock traders now use ETFs as the main instrument for their portfolio since these products became very popular. They use exchange traded funds to actively participate in the markets and make more money with short-term movements that exchange traded funds do. Their particular interest is for swing trading and position trading strategies with these products.
One of the common problem these swing traders face is how to select the best ETFs to trade. Here you can read one simple technique I use to select the best ETF for bullish trades.
This technique for picking the best ticker uses one core principle and it’s a relative-strength analysis. Comparing the relative performance of two different ETF tickers is a key for this technique.
What is a relative performance?
Relative performance analysis typically compares two instruments, and its main aim is to decide which one acts better, that is, is it more bullish than the second one. One way to do this is compare the two charts during the same period, like daily. Here’s an example.
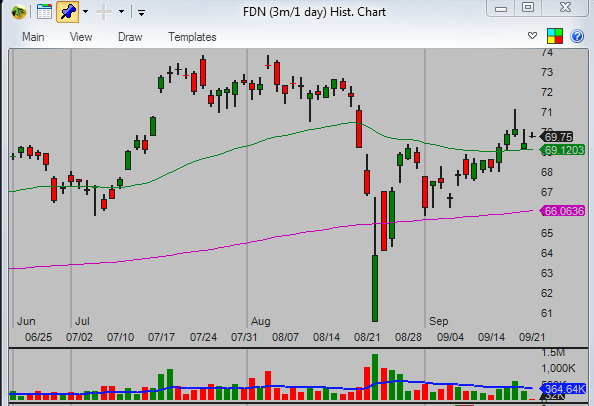
When you check the chart of FDN, you see clearly that this stock acts bullishly compared to the MOO. The price is above the 200-day moving average, the major line dividing bearish and bullish trends. The price recovered quickly also above the 50-day moving average after a previous quick drop.
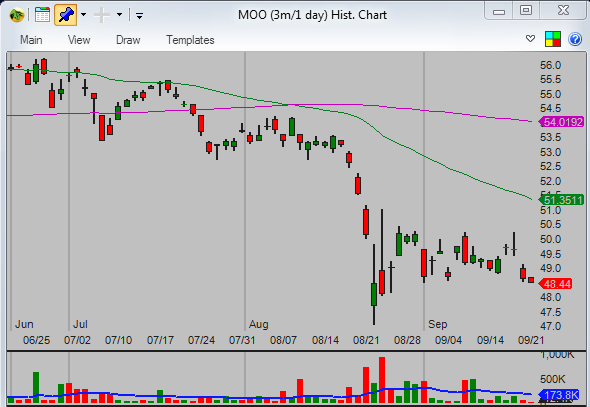
The second ticker, MOO, is much more bearish. The price was well below the 200-day moving average in August before the market drop. And the recovery is almost nonexistent. The price moves “more to the right” than to the upside. This signals an important weakness.
This analysis leads to important decisions for trend traders and their strategies. The FDN ticker is much more suitable to buy than the MOO ticker. MOO is a better ETF pick for bearish strategies that expect the weakness will continue.
Set your chart layout
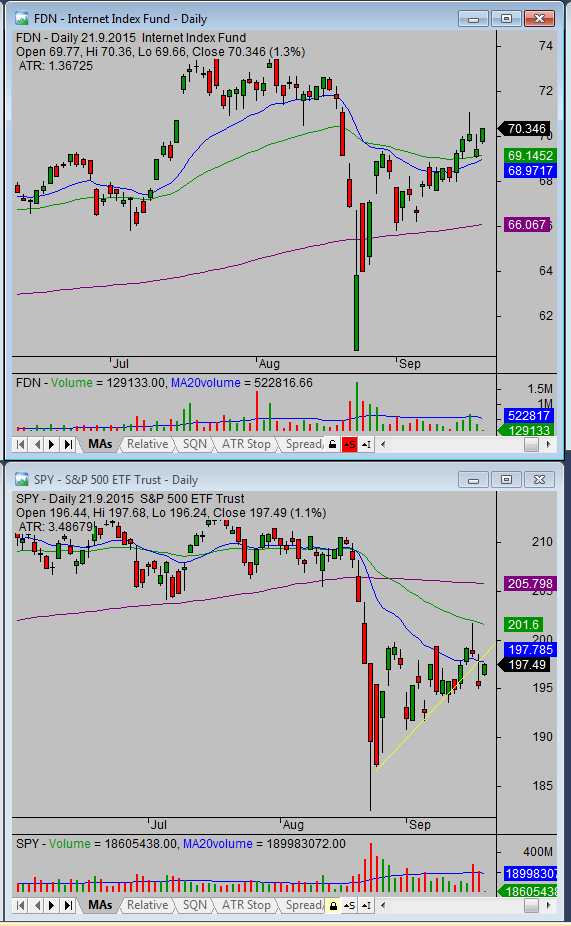
If you want to use this technique, you have to see both charts together to see the difference and perform relative strength analysis. So you should set up your chart layout accordingly. The best ways is to place the first chart above the second one.
But you can also place these two charts next to each other.
Click Here to see larger image
Compare only relevant tickers
When doing this comparison, you have to consider only relevant ETF tickers. You have to compare one US sector to another US sector. It makes no sense to compare gold ETFs to U.S. financial sector ETFs. Although it can show relative performance, it’s much better to compare only relevant ETFs.
So if you want to compare some commodity ETF like GLD, compare it with another commodity ETF, like SLV or PPLT.
Create three lists of tickers
You can do this analysis with every ETF ticker you want to trade. You can compare the relative performance of stock market sectors on the US stock market or on your local stock market. It can be a German stock market, stocks traded in the UK or even Asian ETF shares traded in Hong Kong or Singapore.
You should finish with three lists based on this analysis routine. The first contains the most promising bullish ETF tickers. The second contains the most promising bearish ETF tickers, for short-sell trades. And finally, there’s a list of tickers that don’t show any significant strength or weakness. Yes, not all tickers are suitable for bullish or bearish trades, and your bullish and bearish lists should contain only the best opportunities.
Although you can do this performance analysis daily, it isn’t necessary. It’s enough to scan relative performance once or twice a week, maximum. I prepare my own list once a week. This list is also available in my private members-only site for stock traders. (You can check the details and join too.) I use this list during the next few days to check whether some of the pre-selected tickers offer tradeable setups for my ETF swing trading strategy.
Find more on related pages
- Find trading ideas also for international ETF shares
- Find more details about DIA ETF shares
- Identify more ideas about ETF trading strategies