If you incorporate classic or inverse head and shoulders chart pattern into your trading strategy, you have to define a way to find these reversal patterns on stock charts.
You have typically two options. The first one is to find these patterns visually when you analyze chart of stock ticker you have in your watch lists. The second option is to use automated screener looking for classic and inverted head and shoulders chart patterns.
Visual analysis
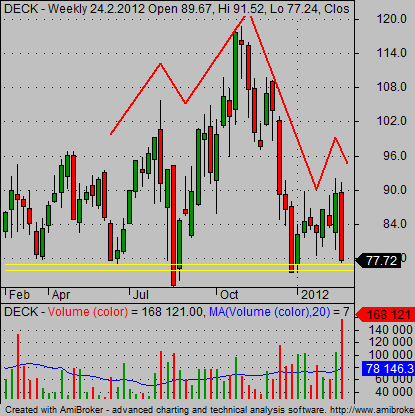
When you look at stock charts for some time during your stock chart analysis routine you start to recognize several basic patterns almost automatically. If you use good stock analysis software then you can easily draw trendlines that help you to visualize these patterns. The typical example is below:
Free chart pattern screener
Stock screener looking automatically for specific chart pattern is the second way how to find stock picks with these two reversal patterns. Very good technical screener is available on FinViz website.
You can find the list of stock with these patterns on their daily graph easily using FinViz. Just select “Screener” option from the Main menu. Then use Signal option just under the Main menu to select classic version or inverse head and shoulders pattern. You can see the drop down list on this image below.

FinViz scans the entire US market and provides you with the list of stocks . You can see the list of tickers or the list of charts with classic or inverse patterns visually presented. Here is an example of one stock pick with inverse type of the head and shoulders pattern.

This screener scans the entire US stock market so it is good to use some additional parameters for a screener. You should trade only liquid stocks so include some minimum level of average trading volume to the parameter list.
Find more on related pages
- Master the trading of head and shoulders pattern
- Expand your knowledge about inverted head and shoulders chart pattern trading
- Explore more ideas about chart pattern trading and analysis