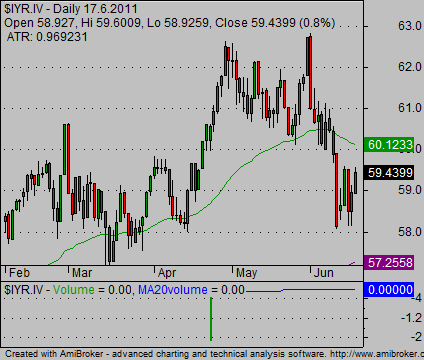
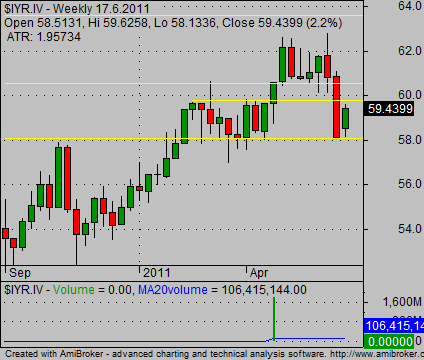
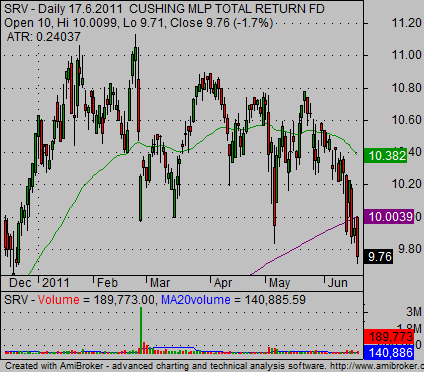
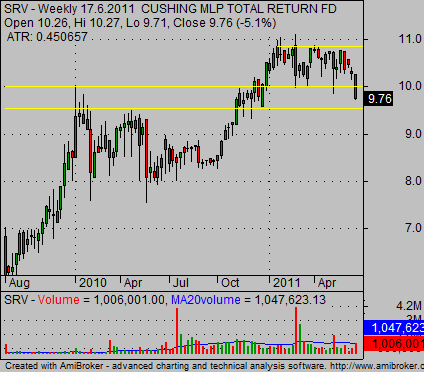
Weekly stock charts should be part of your technical chart analysis. Set your charting software to show several charts in different time frames on the same screen. Review daily and monthly charts together with a weekly time frame.
This setup of live stock charts is useful for swing trading but also for position traders with ETFs or stocks. You will prepare entry and exit points for a trade on daily charts. But weekly stock charts are important to see the bigger picture. The analysis of the technical situation of any market ticker is not complete without a check of the weekly time-frame on the price chart.
You can often see that the situation on the daily chart is not very clear. It is easier to read support and resistance levels on some form of long-term technical charts.
How to analyze weekly stock charts in your charting software
You should always look for important levels of support and resistance. You have to find the answers to questions like: Is the current price near this level? Is there a possibility to move to another important level – up or down? And weekly stock charts help to find answers.
Check below to see how easy it is to read technical charts when they are in bigger time-frames like a weekly period.


If you want to trade specific shares or ETFs then it is important to see and know these levels. Why? It is not worth entering a new long trade if the share price is close to a strong level of resistance.
Also if the share price is pulling back from a strong support level it can be good to enter a long trade. Or if the price is breaking an important level of support or resistance it can offer a very good trading opportunity.
Identification of support and resistance levels can also help with definitions of possible target and stop loss level for such a trade.It is important for money management of your stock trades. Also you know where to exit the trade.
Find more on related pages
- Lift your profits with proper using of stock market charts
- Simple steps to to make easy to read stock charts
- Find further details about profitable chart reading