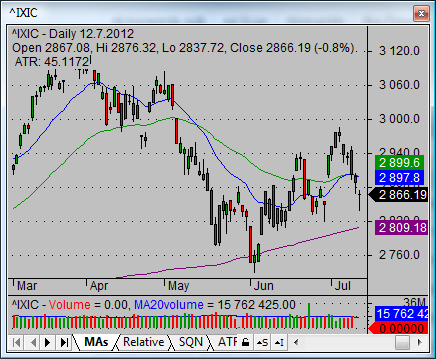
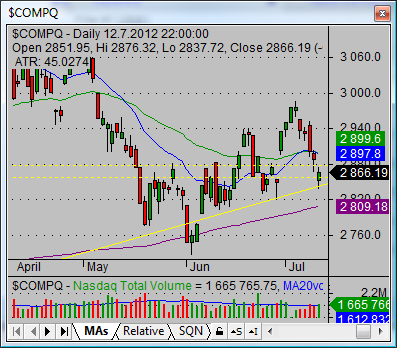
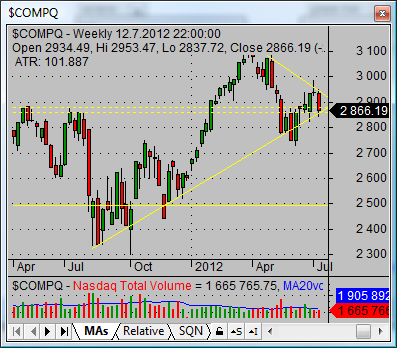
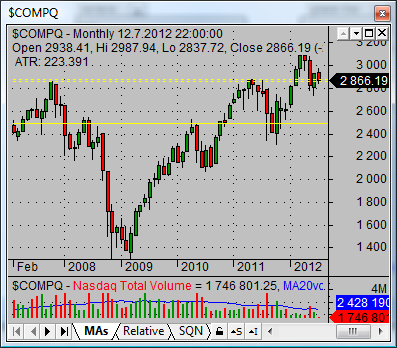
Nasdaq composite index is one of the most important US stock market indexes an is often mentioned in TV news, in market reports and you can find it on the best online trading sites too. I personally use the Nasdaq composite index on a daily basis for current situation analysis.
But why is this index so important and so popular? Well when I wonder about the answer to this question I have to say that the value of the index has importance for the psychology of many professional and private investors. Many private investors tend to think about the performance of this index as the performance of US economy. Although there could be some link, I think that this is not so easy.
I personally like to use the Nasdaq composite index for analysis of important parts of US markets. Nasdaq is the US exchange where technology stocks are listed and these sectors gained great importance in the global economy since 1990.
So if any trader wants to analyze the situation on US equity market then he/she must do analysis of Nasdaq composite index and then also some other index that covers other sectors – like S&P500 or Dow Jones Industrial Average indexes.
What is Nasdaq composite index
This major Nasdaq index provides information about combined performance of all domestic and international-based common stocks listed on The Nasdaq Stock Market. This index was created in 1971. This is a market weighted, a very broad index as it includes more than 3000 securities. So it provides a much broad picture for performance of all technology stocks listed on this US exchange than the narrower Nasdaq-100 index.
Choosing paid or free ticker for charts
The ideal way to analyze major market indexes is to use some good chart analysis software that will allow you to create ideal charts. This includes daily graph and also weekly or monthly charts with history of index value development.
The symbol for this index little varies based on the provider of historical or real time quotes. When using Yahoo websites as a free quotes source then you can find that a ticker for the Nasdaq stock market index is ^IXIC.

I use Esignal data source for AmiBroker – my chart analysis program – and there is another ticker for this broad index. It is COMPQ.

Using multiple time frames for analysis of stock market history graph
The core analytic prerequisite for best analysis of the Nasdaq stock market index is to use multiple time frames. The core analysis is done on the daily time frame for most trading and investing systems used by traders and investors. But using a weekly time-frame or monthly time-frame is important too. So do not forget to set up your graph layout for these three main time frames.


What to analyze on Nasdaq index history graph
The purpose of the Nasdaq index analysis is to have a clear picture of the situation. Looking at the charts should provide you with this main key information
- What is the actual market trend situation ?
You have to understand what is the Nasdaq index doing now. Whether it is bullish or bearish or neutral. This information is needed for two key decisions that every stock trader should do before trading. What type of strategy to use and what type of stock screener to use. - What are the major levels of support and resistance ?
This information is needed, as we have to know whether the stock indexes has some room for further move or if they are now on key level and we have to wait to see what is going to happen.
Find more on related pages
- What Nasdaq index fund to trade
- Learn to use stock index charts
- Read more tips for traders and investors