Pennants and flags chart pattern are very solid option for stock traders. They signal very good trading opportunities. This type of patterns is quite well known and widely used because it provides very good probability of profitable result for trades.
It can be used in intra-day trading and intra-day charts, swing and position traders are using this chart pattern on daily and weekly charts too. I like these chart patterns, and a lot of other traders agree that they’re the most reliable chart patterns.
When to look for flags and pennants pattern
They’re known as continuation stock chart patterns. You can find them after a strong trend move. These patterns represent consolidation and little sideways movement. When the price breaks from the pattern, then the trend resumes again.
There are bullish and bearish versions of this pennants and also of flags pattern. It is well documented in most good books for stock traders. I have summarized most important info about them on this page.
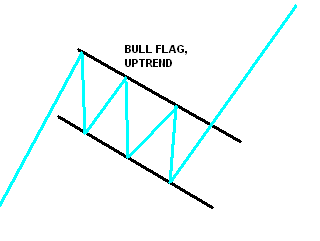
Bullish version of flags chart pattern
The bullish version has lower lows and lower highs against the previous main trend direction. Trend lines for highs and lows are parallel. Check the image below.

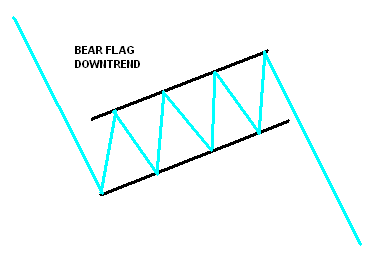
Bearish flag chart pattern
The bearish type of pattern is based on higher highs and higher lows against the major trend.

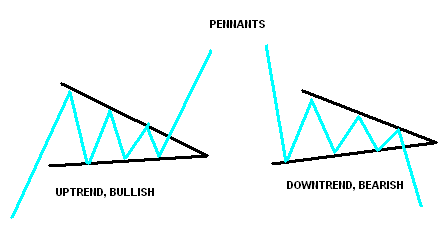
Pennant chart pattern
Pennants have another design. Trend lines are not parallel, but they’re going to meet at one point. Pennants pattern is smaller in size and also needs less time to develop.

I like these pennants chart patterns very much. A lot of my trade setups are based on these patterns.
Tips to trade pennants chart patterns
I put a lot of attention to trading volume in my technical analysis of price charts. The trading volume can tell you a lot about other players on financial markets.
When I see pennants pattern I like to see that volume during development of this pattern is decreasing. It means that investors are not heavy closing their positions but patiently wait for continuation of former trend move ( uptrend or downtrend )
And finally when price is breaking from these continuation chart patterns I like to see increase in stock trading volume. It is good to have some way how to monitor share volume intraday to be alerted in advance when volume is increasing above average level.
Find more on related pages
- Learn to find pennants and flags chart pattern
- Identify really good free stock chart sites
- Watch over my shoulder how I trade stock market every day
- Explore more ideas how to use stock chart patterns for profitable stock trading