Yesterday I used a simple day trading chart patterns strategy for intraday trade with AAPL stock. I like to trade chart patterns in all my stock market trading strategies. I use technical day trading tools exclusively for every daytrade.
I do not see too many daytrading opportunities during the first and last days of week, i.e. on Mondays or on Fridays. So I do not make a lot of daytrades during these days. If there is some opportunity, then it is typically the only one for the day. Like this one with AAPL stock where I used pennant day trading chart patterns strategy.
Basic terminology for this day trading strategy
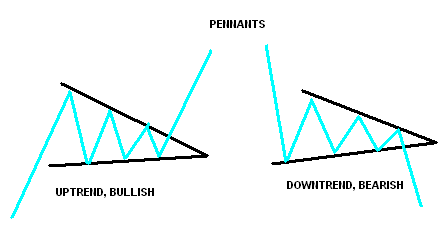
The pennant chart patterns are typical trend patterns that are used for trend strategies. This pattern expects that price has moved during some trend move – bearish or bullish – and now rests in this chart pattern. There is expectation that when price breaks from the pennant chart pattern in the direction of a previous trend move that the new leg of the trend move is going to happen.
What is current market situation
I have monitored the current situation on broad market. I use TRIN and TRINQ as two main market breadth daytrading indicators. They tell me whether the market is bullish or bearish generally. I have seen that TRIN moved into bullish territory in the morning and held there.
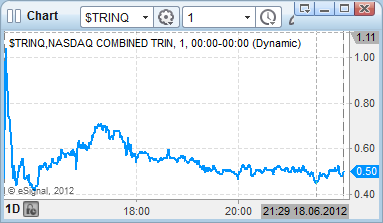
So I have thought about a bullish strategy for the daytrade.
Day trading top pick
Now I need to decide what ticker I am going to day trade. I generally use only a few market tickers for my daytrading strategies. Finally, I have selected AAPL ticker as the best pick for today’s trading.
Check of aapl quote chart
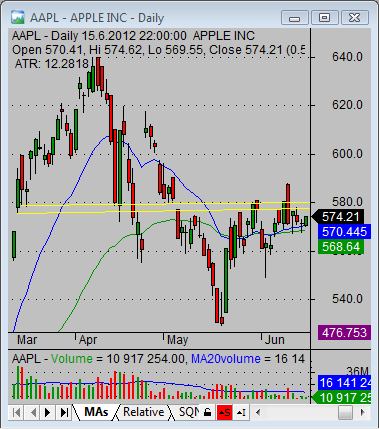
Now I have to check the actual AAPL situation. I have seen that the daily price chart of this ticker is quite bullish. So it confirms my selection of AAPL for this bullish daytrade.
Check of AAPL technicals on its chart
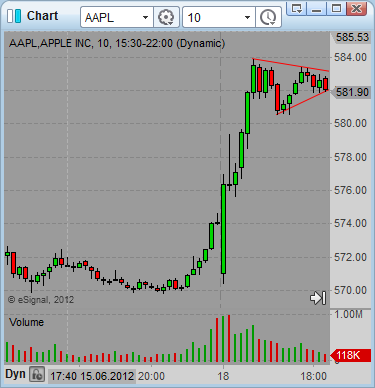
I have monitored AAPL chart as it developed during intraday hours. The price moved up in a strong uptrend in the first hour of the day. Then the price started to rest and form a pennant chart pattern. I started to think about using pennant day trading chart patterns strategy for this single daytrade.
Trading chart patterns setup for pennant day trading
I started to prepare a complete daytrading setup for pennant trading chart patterns strategy. I have set the entry price above the upper resistance line of this pennant chart pattern. I personally have set an entry price to 583.60.
My stop loss level was the second value I had to set up for this trade. I have set 582.45 as stop loss level price. If the price will return to this price level after my entry I would think that the breakout from the pennant daytrading pattern failed.
And finally I tried to set some target for this daytrade. I have noticed that AAPL stock price could advance more if the uptrend is also supported by the general stock market mood. So I have used a price move projection of a previous move and set the price target near 595.
Stock market risk management for AAPL technicals
I placed these values into my risk management spreadsheet and checked risk reward ratio value. It was well above the 3 that is needed. I also noticed the calculated value for 3R (three times risk level) was above 587.
AAPL stock day trade execution
I placed my orders into stock broker software and waited. Price moved in the pennant day trading pattern for a while and then finally broke out from the pattern. My entry order was triggered and stop loss and target orders were also fired automatically. I used the bracket order feature of my stock broker software to manage the order for daytrading accordingly.
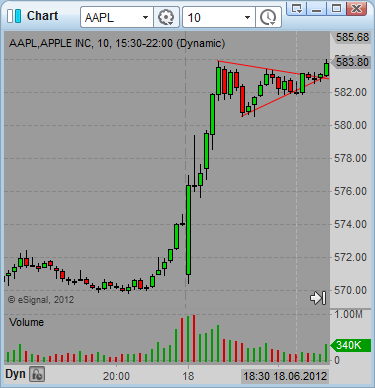
Price started to move in my direction. As the price moved up I started to move my stop loss levels as well. I used a technique of trailing stop loss that is based on last candle low.
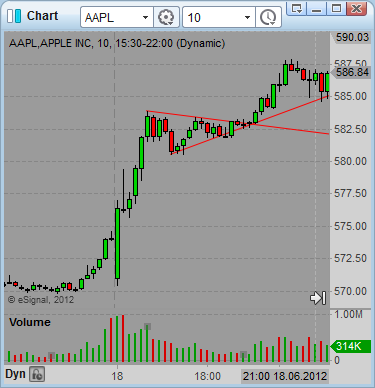
Using this technique I finished the trade near 586.80, as my stop loss order triggered after a decent run up. Although I did not reach my expected target, I booked a nice profit and reached almost 2.7 R for this daytrade.