Candlestick patterns are a very usable stock trading tool. Trading in a bear market or downtrend is much easier when you use bearish candlestick patterns.
The first step is to know the most profitable bearish patterns that you can find on candlestick charts. You can find them on any time frame. These negative candlesticks you can see on intraday chart if you are daytrader or on daily or weekly chart if you prefer to use swing or position trade strategy
Best candlestick patterns for short selling
There are plenty of different candlestick patterns. Most of them are quite complicated, as they are based on three or more candlesticks.
I prefer simple usage of technical analysis tools and this also means that I like to use simplest candle patterns. I use single candlesticks as I think that they can tell a lot too. It is not necessary to have a combination of three or more candlesticks to say something about the situation on a stock chart.
A candlestick or patterns based on two candles, could be very useful and could provide a lot of information about a situation.
Here are examples of patterns that are most useful in trading when you want to use short selling.
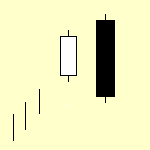
The first candlestick combination is called Bearish engulfing. It can be seen as a mix of the white candle (positive) and long black candle (negative). The bearishness of this pattern is based on the reading that the black candle negates the bullish bias from the previous day. It also signals a change in a direction of the movement.
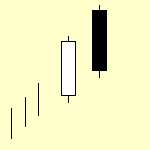
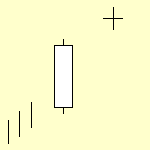
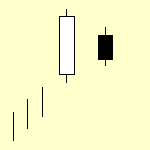
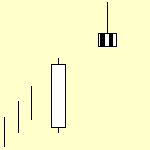
You should use them as a warning signal that the latest price move could be finishing and you could expect a reversal. It is very useful when such pattern is found in a pullback a against prevailing trend – in this case it is a major bearish trend and corrective pullback that moves price up a little bit.
Example of online stock trade based on candlestick patterns
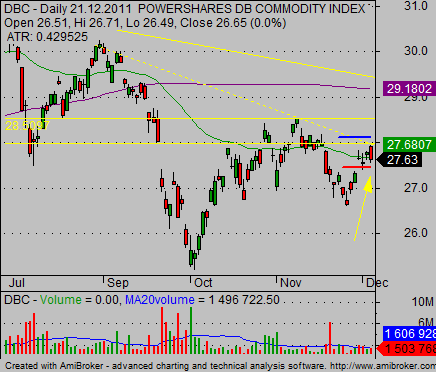
Here is the example of a trade I’ve made in my portfolio. DBC – commodity ETF was in a downtrend. It has made a correction to a major resistance level. It is possible to see several important single candlesticks near this important level of resistance. There is also a moving average and trendline
in the same position – it is making this level much more important.
A negative candlestick combination – bearish engulfing – has developed and I have prepared an ETF trading setup. The red line indicates entry point for short sale of this commodity ETF. Blue line indicates stop loss level. I expect that my target for this trade will be near October lows or lower.
I entered the trade in the next days and here is a current chart of how the trade developed since then. It is now clearly in the profit area and I can use my trade management techniques to move my stop loss level and also to take partial profits from this trade.
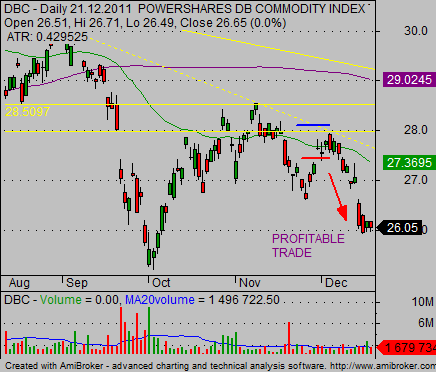
The best way is to combine candlesticks together with other technical analysis tools. This combination is important as it makes any trade setups much powerful. The probability of positive result for a trade that uses the candlestick idea is much higher.
Find more on related pages
- When to prefer candlestick charts
- How to trade stocks with bullish chart patterns
- Find more details in Candlestick tutorial